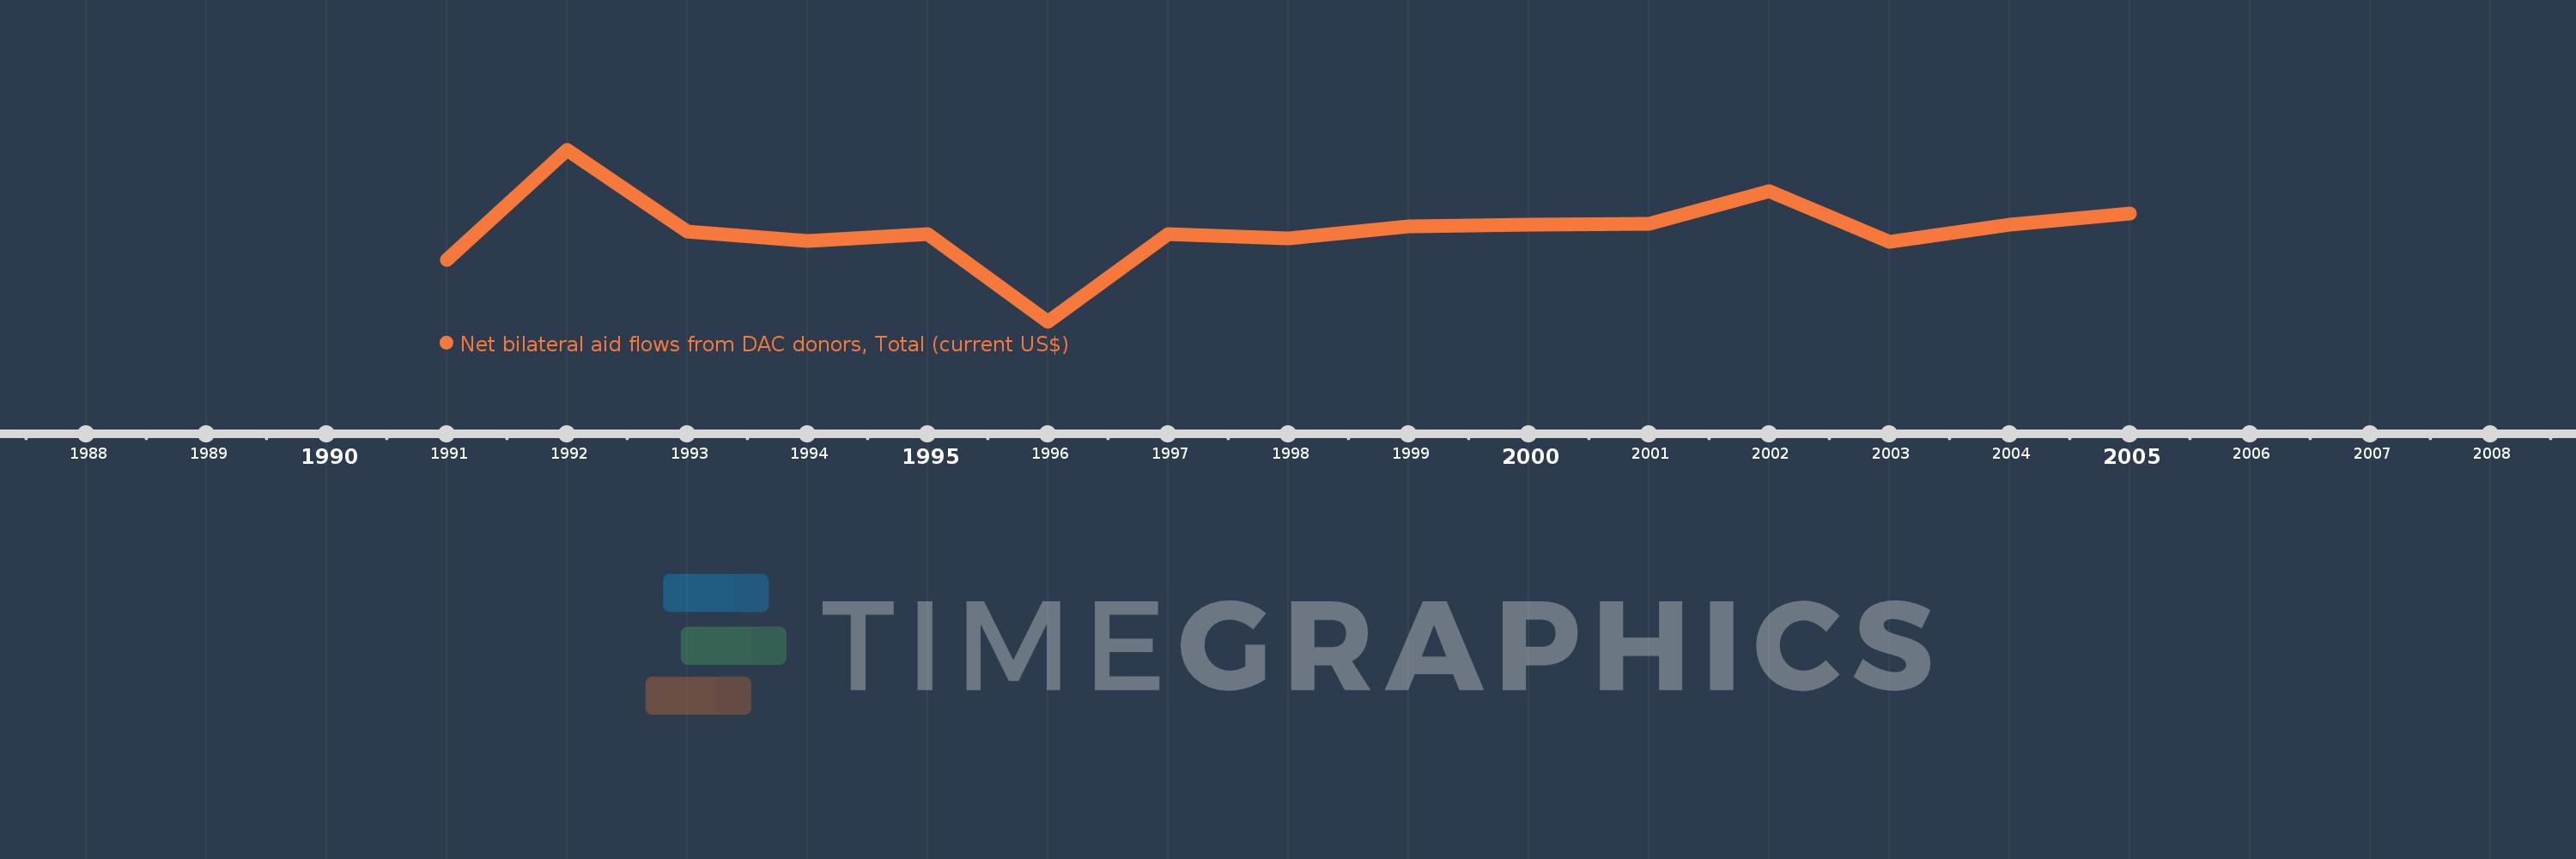
This timeline shows a graph from 1991 to 2005 of Hungary. No data until 1990. Number of actual observations by date: 15.
Source name:
World Development Indicators
Source organization:
Development Assistance Committee of the Organisation for Economic Co-operation and Development, Geographical Distribution of Financial Flows to Developing Countries, Development Co-operation Report, and International Development Statistics database. Data are available online at: www.oecd.org/dac/stats/idsonline.
Categories, topics:
Aid Effectiveness
Last updated:
apr 23, 2017
Indicators value changes by year
Meaning:
214.075 mln
Minimum:
-248.49 mln
jan 1, 1996
Maximum:
620.16 mln
jan 1, 1992
At the date of observation
Value
Absolute change
Change from the previous value
jan 1, 1991
63.71 mln
+63.71 mln
0.0%
jan 1, 1992
620.16 mln
+556.45 mln
873.41%
jan 1, 1993
210.57 mln
-409.59 mln
-66.05%
jan 1, 1994
159.36 mln
-51.21 mln
-24.32%
jan 1, 1995
193.67 mln
+34.31 mln
21.53%
jan 1, 1996
-248.49 mln
-442.16 mln
-228.31%
jan 1, 1997
197.83 mln
+446.32 mln
-179.61%
jan 1, 1998
172.22 mln
-25.61 mln
-12.95%
jan 1, 1999
233.9 mln
+61.68 mln
35.81%
jan 1, 2000
245.49 mln
+11.59 mln
4.96%
jan 1, 2001
249.25 mln
+3.76 mln
1.53%
jan 1, 2002
414.07 mln
+164.82 mln
66.13%
jan 1, 2003
157.0 mln
-257.07 mln
-62.08%
jan 1, 2004
244.1 mln
+87.1 mln
55.48%
jan 1, 2005
298.29 mln
+54.19 mln
22.2%
Ranking of countries by current statistics by years
