29
/
en
AIzaSyAYiBZKx7MnpbEhh9jyipgxe19OcubqV5w
April 1, 2024
45370
Low & middle income
LMY
false
2
1
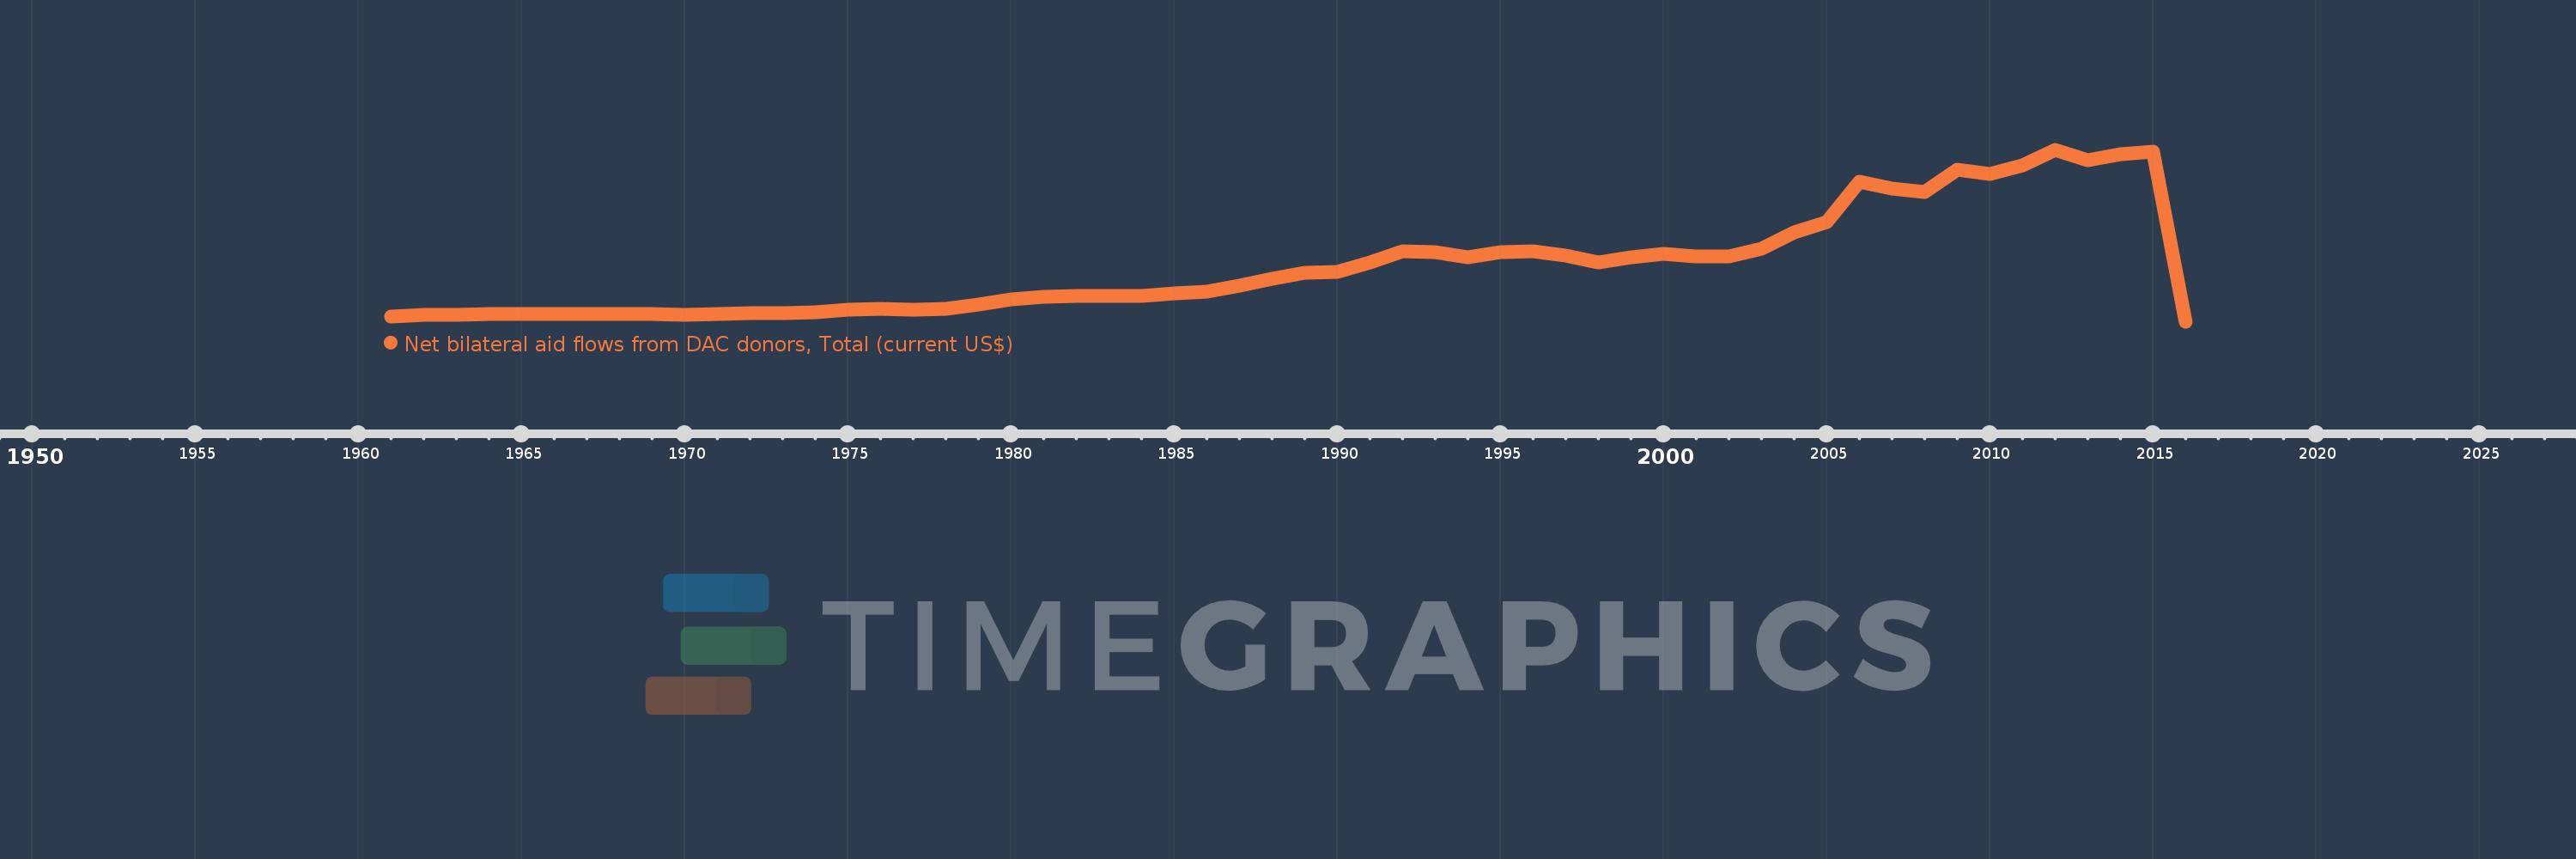
Net bilateral aid flows from DAC donors, Total (current US$)
2016,2015,2014,2013,2012,2011,2010,2009,2008,2007,2006,2005,2004,2003,2002,2001,2000,1999,1998,1997,1996,1995,1994,1993,1992,1991,1990,1989,1988,1987,1986,1985,1984,1983,1982,1981,1980,1979,1978,1977,1976,1975,1974,1973,1972,1971,1970,1969,1968,1967,1966,1965,1964,1963,1962,1961
This statistics in other country:
AfghanistanAlbaniaAlgeriaAngolaAntigua and BarbudaArab WorldArgentinaArmeniaArubaAzerbaijanBahamas, TheBahrainBangladeshBarbadosBelarusBelizeBeninBermudaBhutanBoliviaBosnia and HerzegovinaBotswanaBrazilBritish Virgin IslandsBrunei DarussalamBulgariaBurkina FasoBurundiCabo VerdeCambodiaCameroonCaribbean small statesCayman IslandsCentral African RepublicCentral Europe and the BalticsChadChileChinaColombiaComorosCongo, Dem. Rep.Congo, Rep.Costa RicaCote d'IvoireCroatiaCubaCyprusCzech RepublicDjiboutiDominicaDominican RepublicEast Asia & PacificEast Asia & Pacific (excluding high income)East Asia & Pacific (IDA & IBRD countries)EcuadorEgypt, Arab Rep.El SalvadorEquatorial GuineaEritreaEstoniaEthiopiaEuro areaEurope & Central AsiaEurope & Central Asia (excluding high income)Europe & Central Asia (IDA & IBRD countries)European UnionFijiFragile and conflict affected situationsFrench PolynesiaGabonGambia, TheGeorgiaGhanaGibraltarGrenadaGuatemalaGuineaGuinea-BissauGuyanaHaitiHeavily indebted poor countries (HIPC)High incomeHondurasHong Kong SAR, ChinaHungaryIBRD onlyIDA & IBRD totalIDA blendIDA onlyIDA totalIndiaIndonesiaIran, Islamic Rep.IraqIsraelJamaicaJordanKazakhstanKenyaKiribatiKorea, Dem. People’s Rep.Korea, Rep.KosovoKuwaitKyrgyz RepublicLao PDRLatin America & Caribbean Latin America & Caribbean (excluding high income)Latin America & the Caribbean (IDA & IBRD countries)LatviaLeast developed countries: UN classificationLebanonLesothoLiberiaLibyaLithuaniaLow & middle incomeLow incomeLower middle incomeMacao SAR, ChinaMacedonia, FYRMadagascarMalawiMalaysiaMaldivesMaliMaltaMarshall IslandsMauritaniaMauritiusMexicoMicronesia, Fed. Sts.Middle East & North AfricaMiddle East & North Africa (excluding high income)Middle East & North Africa (IDA & IBRD countries)Middle incomeMoldovaMongoliaMontenegroMoroccoMozambiqueMyanmarNamibiaNauruNepalNew CaledoniaNicaraguaNigerNigeriaNorth AmericaNorthern Mariana IslandsOECD membersOmanOther small statesPacific island small statesPakistanPalauPanamaPapua New GuineaParaguayPeruPhilippinesPolandQatarRomaniaRussian FederationRwandaSamoaSao Tome and PrincipeSaudi ArabiaSenegalSerbiaSeychellesSierra LeoneSingaporeSlovak RepublicSloveniaSmall statesSolomon IslandsSomaliaSouth AfricaSouth AsiaSouth Asia (IDA & IBRD)South SudanSri LankaSt. Kitts and NevisSt. LuciaSt. Vincent and the GrenadinesSub-Saharan Africa Sub-Saharan Africa (excluding high income)Sub-Saharan Africa (IDA & IBRD countries)SudanSurinameSwazilandSyrian Arab RepublicTajikistanTanzaniaThailandTimor-LesteTogoTongaTrinidad and TobagoTunisiaTurkeyTurkmenistanTurks and Caicos IslandsTuvaluUgandaUkraineUnited Arab EmiratesUpper middle incomeUruguayUzbekistanVanuatuVenezuela, RBVietnamWest Bank and GazaWorldYemen, Rep.ZambiaZimbabwe Timeline:
This timeline shows a graph from 1961 to 2016 of Low & middle income. No data until 1960. Number of actual observations by date: 56.
Source name:
World Development Indicators
Source organization:
Development Assistance Committee of the Organisation for Economic Co-operation and Development, Geographical Distribution of Financial Flows to Developing Countries, Development Co-operation Report, and International Development Statistics database. Data are available online at: www.oecd.org/dac/stats/idsonline.
Categories, topics:
Aid Effectiveness
Last updated:
apr 23, 2017
Indicators value changes by year
Maximum:
111.44 bln
jan 1, 2012
At the date of observation
Value
Absolute change
Change from previous value
jan 1, 1961
3.638 bln
+3.638 bln
0.0%
jan 1, 1962
4.528 bln
+890.35 mln
24.48%
jan 1, 1963
4.634 bln
+105.53 mln
2.33%
jan 1, 1964
4.931 bln
+297.12 mln
6.41%
jan 1, 1965
4.988 bln
+57.14 mln
1.16%
jan 1, 1966
5.273 bln
+284.9 mln
5.71%
jan 1, 1967
5.084 bln
-188.52 mln
-3.58%
jan 1, 1968
5.366 bln
+282.12 mln
5.55%
jan 1, 1969
4.982 bln
-384.13 mln
-7.16%
jan 1, 1970
4.724 bln
-258.0 mln
-5.18%
jan 1, 1971
5.021 bln
+296.72 mln
6.28%
jan 1, 1972
5.645 bln
+624.58 mln
12.44%
jan 1, 1973
5.737 bln
+91.56 mln
1.62%
jan 1, 1974
6.24 bln
+503.46 mln
8.78%
jan 1, 1975
7.72 bln
+1.48 bln
23.71%
jan 1, 1976
8.766 bln
+1.045 bln
13.54%
jan 1, 1977
8.111 bln
-654.57 mln
-7.47%
jan 1, 1978
8.452 bln
+341.17 mln
4.21%
jan 1, 1979
11.544 bln
+3.092 bln
36.58%
jan 1, 1980
14.625 bln
+3.081 bln
26.69%
jan 1, 1981
16.27 bln
+1.645 bln
11.25%
jan 1, 1982
16.783 bln
+512.85 mln
3.15%
jan 1, 1983
17.109 bln
+326.55 mln
1.95%
jan 1, 1984
16.768 bln
-340.7 mln
-1.99%
jan 1, 1985
18.28 bln
+1.512 bln
9.02%
jan 1, 1986
19.688 bln
+1.408 bln
7.7%
jan 1, 1987
23.6 bln
+3.911 bln
19.87%
jan 1, 1988
27.958 bln
+4.359 bln
18.47%
jan 1, 1989
31.939 bln
+3.98 bln
14.24%
jan 1, 1990
32.654 bln
+715.22 mln
2.24%
jan 1, 1991
38.798 bln
+6.144 bln
18.82%
jan 1, 1992
45.736 bln
+6.938 bln
17.88%
jan 1, 1993
45.373 bln
-363.271 mln
-0.79%
jan 1, 1994
41.976 bln
-3.397 bln
-7.49%
jan 1, 1995
45.399 bln
+3.423 bln
8.15%
jan 1, 1996
45.766 bln
+366.81 mln
0.81%
jan 1, 1997
42.963 bln
-2.802 bln
-6.12%
jan 1, 1998
38.522 bln
-4.441 bln
-10.34%
jan 1, 1999
41.835 bln
+3.313 bln
8.6%
jan 1, 2000
44.188 bln
+2.353 bln
5.62%
jan 1, 2001
42.3 bln
-1.887 bln
-4.27%
jan 1, 2002
42.45 bln
+149.59 mln
0.35%
jan 1, 2003
47.593 bln
+5.144 bln
12.12%
jan 1, 2004
58.119 bln
+10.526 bln
22.12%
jan 1, 2005
64.993 bln
+6.874 bln
11.83%
jan 1, 2006
91.081 bln
+26.088 bln
40.14%
jan 1, 2007
86.339 bln
-4.741 bln
-5.21%
jan 1, 2008
84.188 bln
-2.151 bln
-2.49%
jan 1, 2009
98.854 bln
+14.666 bln
17.42%
jan 1, 2010
96.004 bln
-2.85 bln
-2.88%
jan 1, 2011
101.779 bln
+5.774 bln
6.01%
jan 1, 2012
111.44 bln
+9.661 bln
9.49%
jan 1, 2013
105.168 bln
-6.271 bln
-5.63%
jan 1, 2014
108.94 bln
+3.772 bln
3.59%
jan 1, 2015
110.609 bln
+1.669 bln
1.53%
jan 1, 2016
0.0
-110.609 bln
-100.0%
Ranking of countries by current statistics by years


Comments: