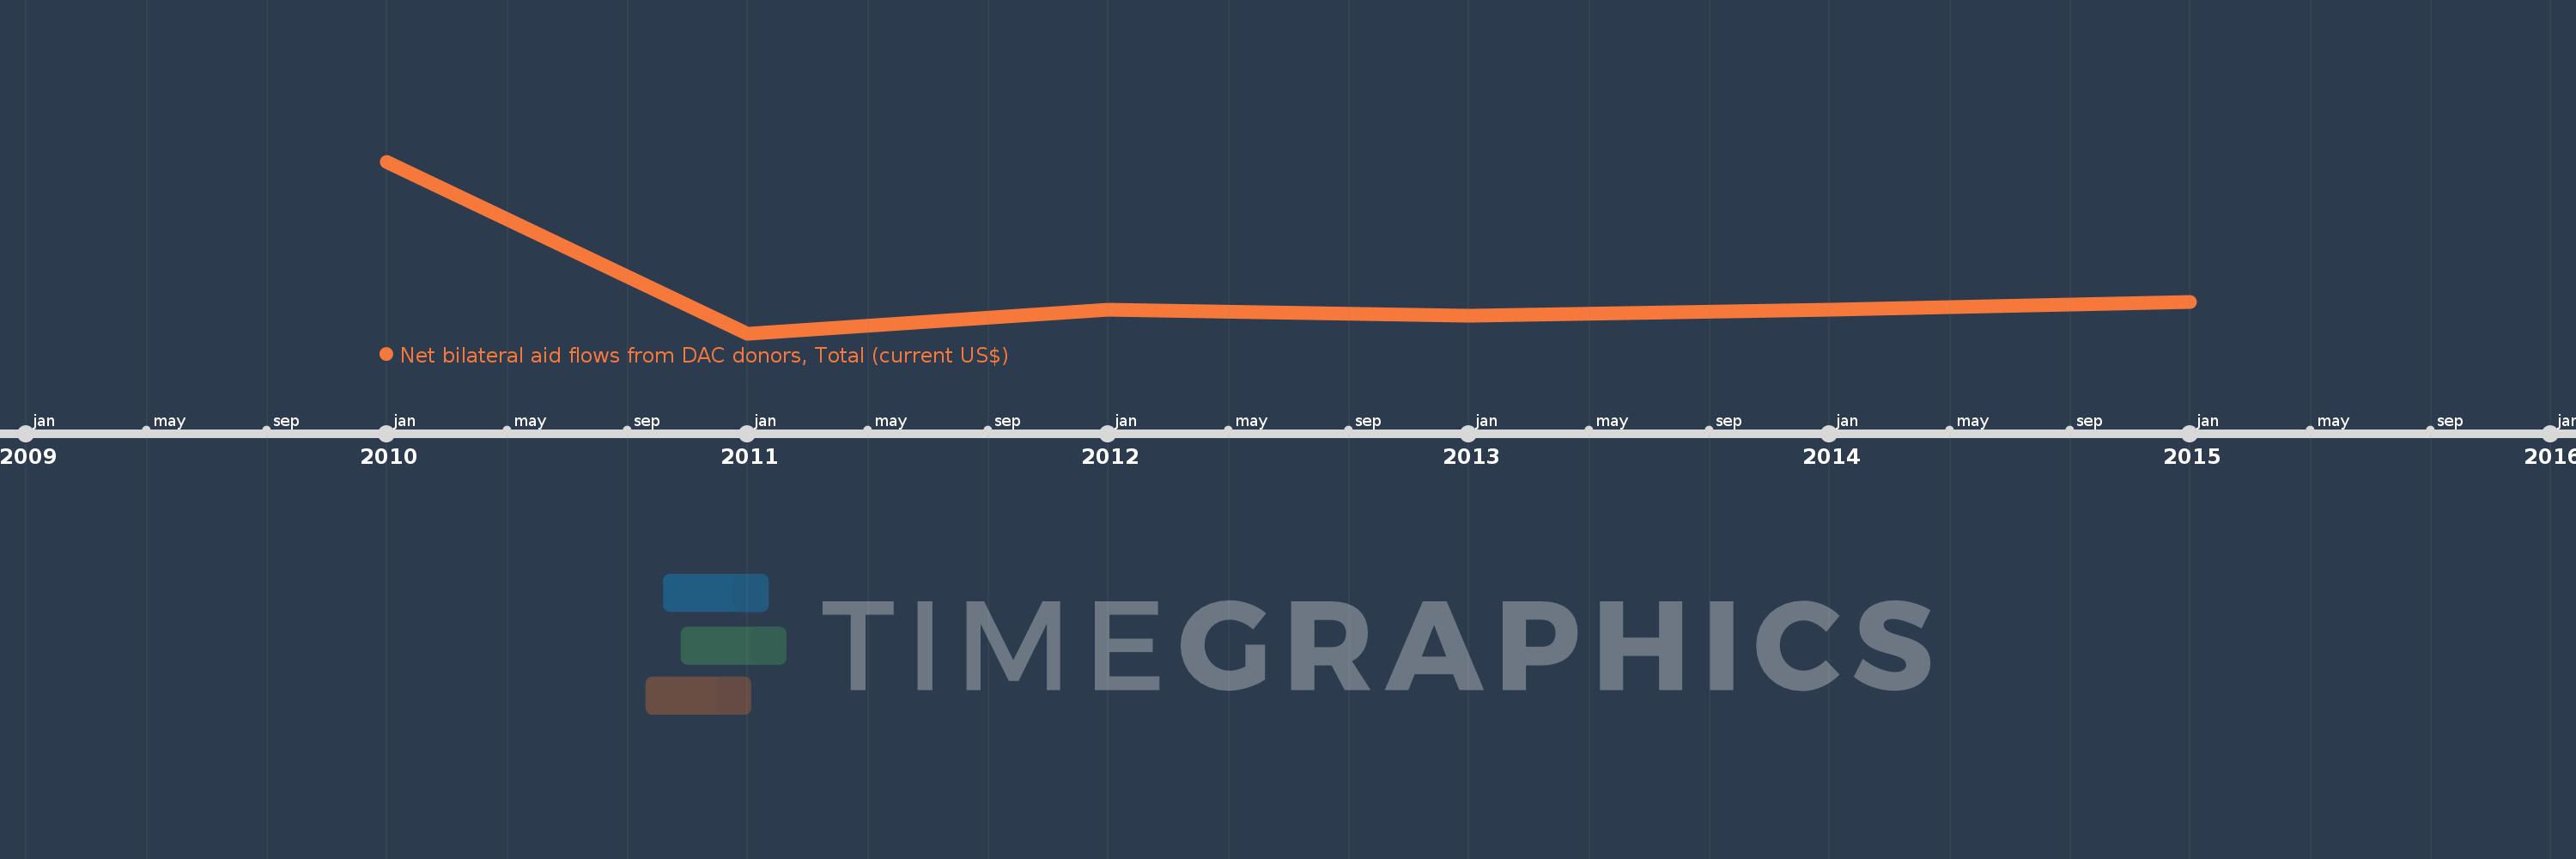
This timeline shows a graph from 2010 to 2015 of Kosovo. No data until 2009. Number of actual observations by date: 6.
Source name:
World Development Indicators
Source organization:
Development Assistance Committee of the Organisation for Economic Co-operation and Development, Geographical Distribution of Financial Flows to Developing Countries, Development Co-operation Report, and International Development Statistics database. Data are available online at: www.oecd.org/dac/stats/idsonline.
Categories, topics:
Aid Effectiveness
Last updated:
apr 23, 2017
Indicators value changes by year
Meaning:
543.35 mln
Minimum:
470.75 mln
jan 1, 2011
Maximum:
750.44 mln
jan 1, 2010
At the date of observation
Value
Absolute change
Change from the previous value
jan 1, 2010
750.44 mln
+750.44 mln
0.0%
jan 1, 2011
470.75 mln
-279.69 mln
-37.27%
jan 1, 2012
509.27 mln
+38.52 mln
8.18%
jan 1, 2013
498.82 mln
-10.45 mln
-2.05%
jan 1, 2014
509.25 mln
+10.43 mln
2.09%
jan 1, 2015
521.57 mln
+12.32 mln
2.42%
Ranking of countries by current statistics by years
