29
/
en
AIzaSyAYiBZKx7MnpbEhh9jyipgxe19OcubqV5w
April 1, 2024
35962
High income
HIC
false
2
1
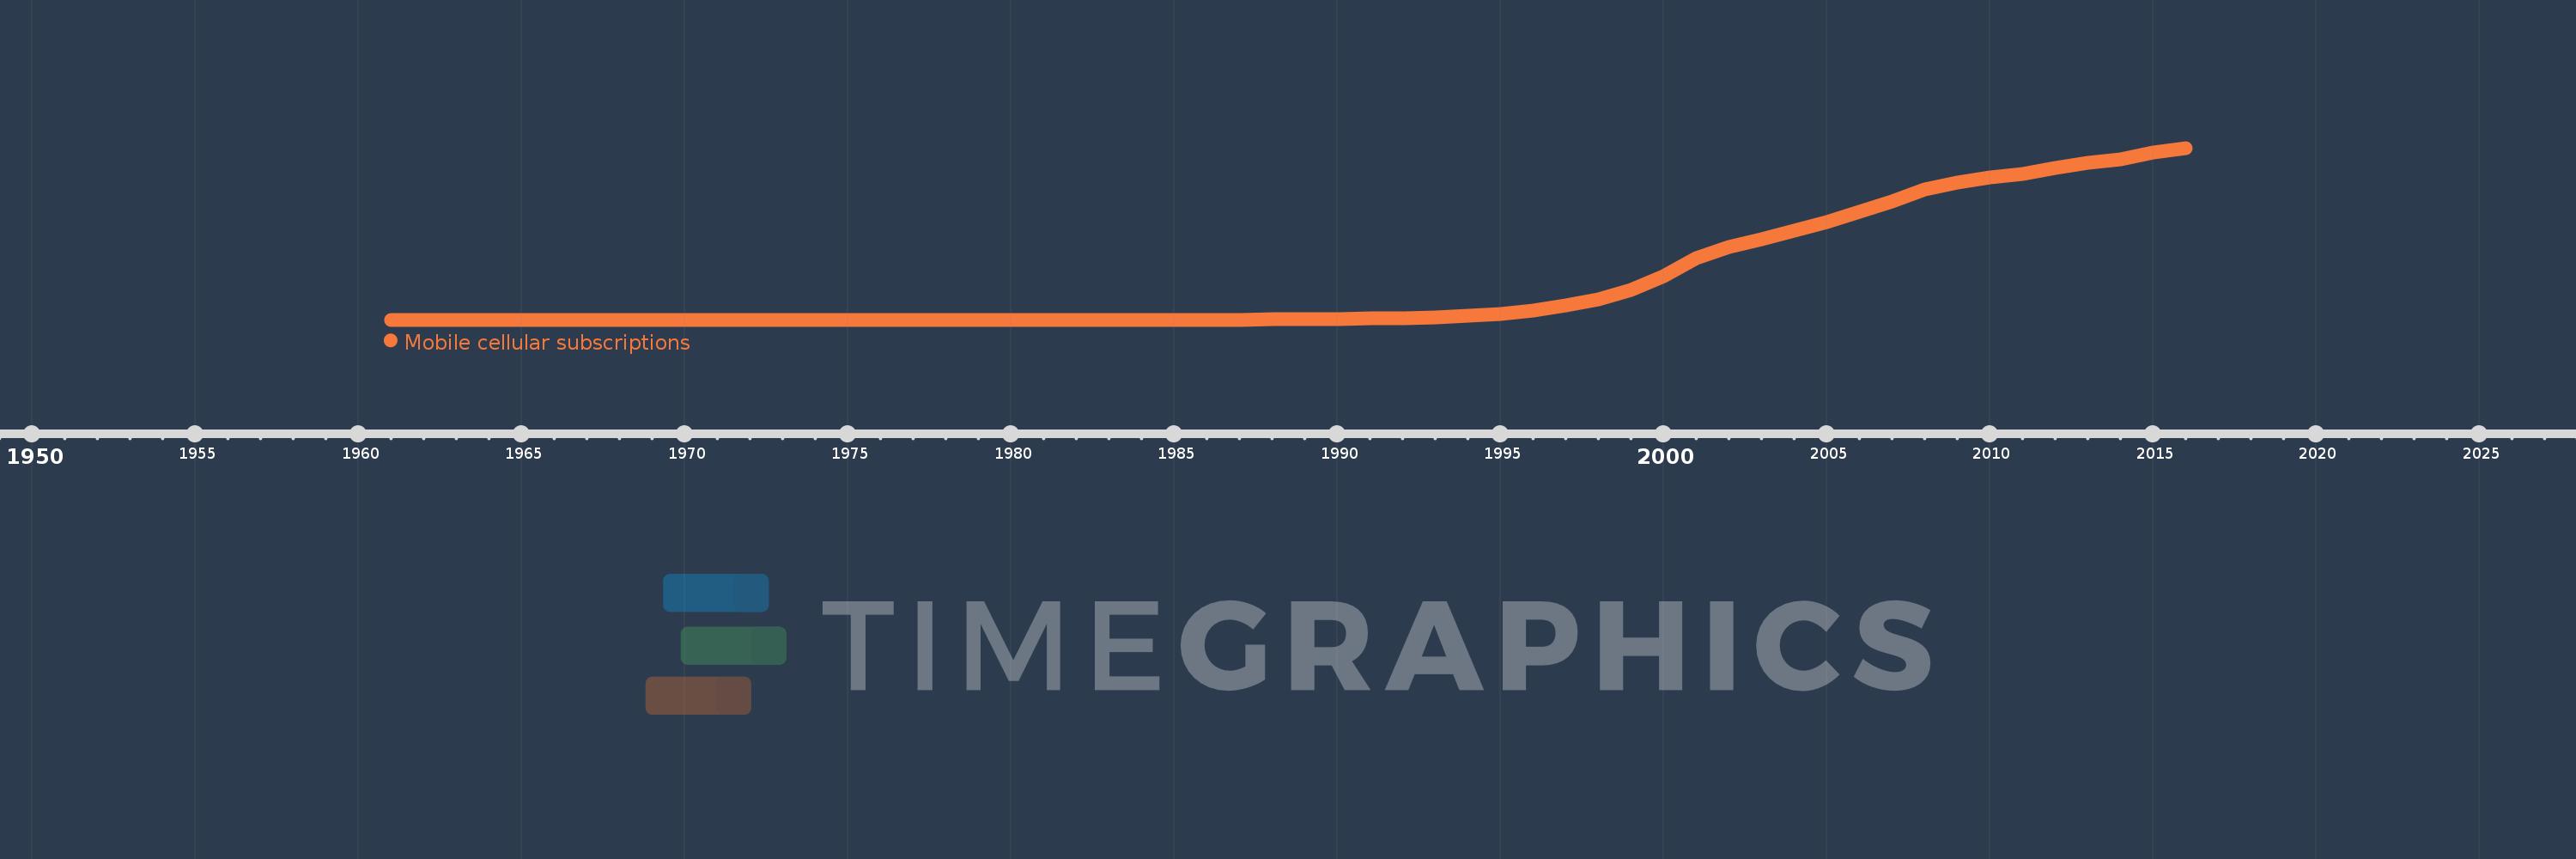
Mobile cellular subscriptions
2016,2015,2014,2013,2012,2011,2010,2009,2008,2007,2006,2005,2004,2003,2002,2001,2000,1999,1998,1997,1996,1995,1994,1993,1992,1991,1990,1989,1988,1987,1986,1985,1984,1983,1982,1981,1980,1979,1978,1977,1976,1971,1966,1961
This statistics in other country:
AfghanistanAlbaniaAlgeriaAmerican SamoaAndorraAngolaAntigua and BarbudaArab WorldArgentinaArmeniaArubaAustraliaAustriaAzerbaijanBahamas, TheBahrainBangladeshBarbadosBelarusBelgiumBelizeBeninBermudaBhutanBoliviaBosnia and HerzegovinaBotswanaBrazilBritish Virgin IslandsBrunei DarussalamBulgariaBurkina FasoBurundiCabo VerdeCambodiaCameroonCanadaCaribbean small statesCayman IslandsCentral African RepublicCentral Europe and the BalticsChadChileChinaColombiaComorosCongo, Dem. Rep.Congo, Rep.Costa RicaCote d'IvoireCroatiaCubaCuracaoCyprusCzech RepublicDenmarkDjiboutiDominicaDominican RepublicEarly-demographic dividendEast Asia & PacificEast Asia & Pacific (excluding high income)East Asia & Pacific (IDA & IBRD countries)EcuadorEgypt, Arab Rep.El SalvadorEquatorial GuineaEritreaEstoniaEthiopiaEuro areaEurope & Central AsiaEurope & Central Asia (excluding high income)Europe & Central Asia (IDA & IBRD countries)European UnionFaroe IslandsFijiFinlandFragile and conflict affected situationsFranceFrench PolynesiaGabonGambia, TheGeorgiaGermanyGhanaGibraltarGreeceGreenlandGrenadaGuamGuatemalaGuineaGuinea-BissauGuyanaHaitiHeavily indebted poor countries (HIPC)High incomeHondurasHong Kong SAR, ChinaHungaryIBRD onlyIcelandIDA & IBRD totalIDA blendIDA onlyIDA totalIndiaIndonesiaIran, Islamic Rep.IraqIrelandIsraelItalyJamaicaJapanJordanKazakhstanKenyaKiribatiKorea, Dem. People’s Rep.Korea, Rep.KosovoKuwaitKyrgyz RepublicLao PDRLate-demographic dividendLatin America & Caribbean Latin America & Caribbean (excluding high income)Latin America & the Caribbean (IDA & IBRD countries)LatviaLeast developed countries: UN classificationLebanonLesothoLiberiaLibyaLiechtensteinLithuaniaLow & middle incomeLow incomeLower middle incomeLuxembourgMacao SAR, ChinaMacedonia, FYRMadagascarMalawiMalaysiaMaldivesMaliMaltaMarshall IslandsMauritaniaMauritiusMexicoMicronesia, Fed. Sts.Middle East & North AfricaMiddle East & North Africa (excluding high income)Middle East & North Africa (IDA & IBRD countries)Middle incomeMoldovaMonacoMongoliaMontenegroMoroccoMozambiqueMyanmarNamibiaNauruNepalNetherlandsNew CaledoniaNew ZealandNicaraguaNigerNigeriaNorth AmericaNorthern Mariana IslandsNorwayOECD membersOmanOther small statesPacific island small statesPakistanPalauPanamaPapua New GuineaParaguayPeruPhilippinesPolandPortugalPost-demographic dividendPre-demographic dividendPuerto RicoQatarRomaniaRussian FederationRwandaSamoaSan MarinoSao Tome and PrincipeSaudi ArabiaSenegalSerbiaSeychellesSierra LeoneSingaporeSint Maarten (Dutch part)Slovak RepublicSloveniaSmall statesSolomon IslandsSomaliaSouth AfricaSouth AsiaSouth Asia (IDA & IBRD)South SudanSpainSri LankaSt. Kitts and NevisSt. LuciaSt. Vincent and the GrenadinesSub-Saharan Africa Sub-Saharan Africa (excluding high income)Sub-Saharan Africa (IDA & IBRD countries)SudanSurinameSwazilandSwedenSwitzerlandSyrian Arab RepublicTajikistanTanzaniaThailandTimor-LesteTogoTongaTrinidad and TobagoTunisiaTurkeyTurkmenistanTurks and Caicos IslandsTuvaluUgandaUkraineUnited Arab EmiratesUnited KingdomUnited StatesUpper middle incomeUruguayUzbekistanVanuatuVenezuela, RBVietnamVirgin Islands (U.S.)West Bank and GazaWorldYemen, Rep.ZambiaZimbabwe Timeline:
This timeline shows a graph from 1961 to 2016 of High income. No data until 1960. Number of actual observations by date: 44.
Source name:
World Development Indicators
Source organization:
International Telecommunication Union, World Telecommunication/ICT Development Report and database.
Categories, topics:
Infrastructure
Last updated:
apr 23, 2017
Indicators value changes by year
Maximum:
1.478 bln
jan 1, 2016
At the date of observation
Value
Absolute change
Change from previous value
jan 1, 1981
23.482K
+23.482K
%
jan 1, 1982
63.585K
+40.103K
170.78%
jan 1, 1983
101.509K
+37.924K
59.64%
jan 1, 1984
148.855K
+47.346K
46.64%
jan 1, 1985
317.502K
+168.647K
113.3%
jan 1, 1986
748.6K
+431.098K
135.78%
jan 1, 1987
1.434 mln
+685.002K
91.5%
jan 1, 1988
2.507 mln
+1.073 mln
74.87%
jan 1, 1989
4.254 mln
+1.747 mln
69.7%
jan 1, 1990
7.212 mln
+2.958 mln
69.53%
jan 1, 1991
10.884 mln
+3.672 mln
50.92%
jan 1, 1992
15.61 mln
+4.726 mln
43.42%
jan 1, 1993
21.889 mln
+6.279 mln
40.22%
jan 1, 1994
31.447 mln
+9.558 mln
43.67%
jan 1, 1995
49.714 mln
+18.267 mln
58.09%
jan 1, 1996
79.112 mln
+29.398 mln
59.13%
jan 1, 1997
124.229 mln
+45.116 mln
57.03%
jan 1, 1998
176.559 mln
+52.33 mln
42.12%
jan 1, 1999
255.262 mln
+78.703 mln
44.58%
jan 1, 2000
376.717 mln
+121.454 mln
47.58%
jan 1, 2001
528.178 mln
+151.461 mln
40.21%
jan 1, 2002
627.721 mln
+99.544 mln
18.85%
jan 1, 2003
692.607 mln
+64.885 mln
10.34%
jan 1, 2004
762.763 mln
+70.157 mln
10.13%
jan 1, 2005
841.986 mln
+79.223 mln
10.39%
jan 1, 2006
928.391 mln
+86.404 mln
10.26%
jan 1, 2007
1.021 bln
+92.711 mln
9.99%
jan 1, 2008
1.123 bln
+101.814 mln
9.97%
jan 1, 2009
1.182 bln
+59.522 mln
5.3%
jan 1, 2010
1.226 bln
+43.121 mln
3.65%
jan 1, 2011
1.256 bln
+30.82 mln
2.51%
jan 1, 2012
1.309 bln
+53.036 mln
4.22%
jan 1, 2013
1.346 bln
+37.07 mln
2.83%
jan 1, 2014
1.376 bln
+29.572 mln
2.2%
jan 1, 2015
1.437 bln
+61.408 mln
4.46%
jan 1, 2016
1.478 bln
+40.504 mln
2.82%
Ranking of countries by current statistics by years


Comments: