29
/
en
AIzaSyAYiBZKx7MnpbEhh9jyipgxe19OcubqV5w
April 1, 2024
30913
Europe & Central Asia
ECS
false
2
1
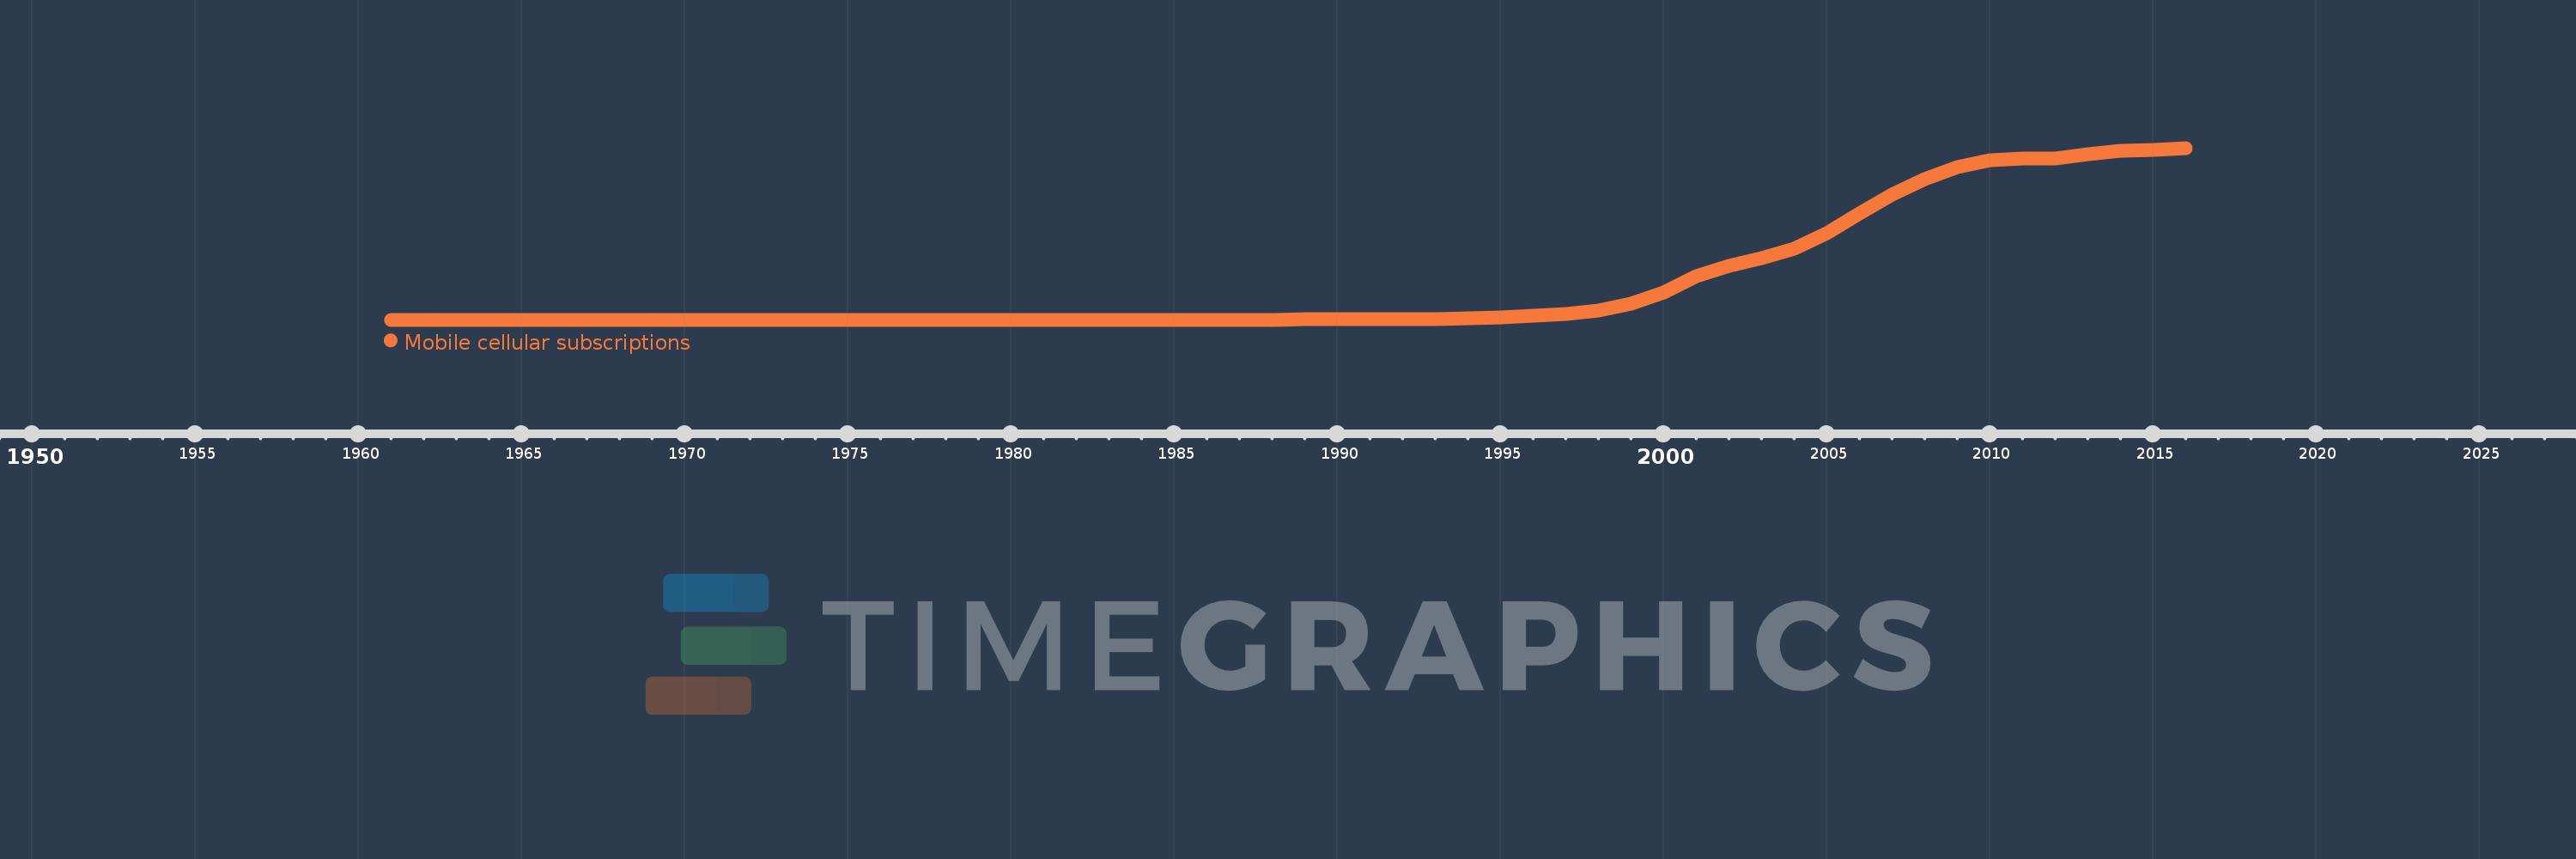
Mobile cellular subscriptions
2016,2015,2014,2013,2012,2011,2010,2009,2008,2007,2006,2005,2004,2003,2002,2001,2000,1999,1998,1997,1996,1995,1994,1993,1992,1991,1990,1989,1988,1987,1986,1985,1984,1983,1982,1981,1980,1979,1978,1977,1976,1971,1966,1961
This statistics in other country:
AfghanistanAlbaniaAlgeriaAmerican SamoaAndorraAngolaAntigua and BarbudaArab WorldArgentinaArmeniaArubaAustraliaAustriaAzerbaijanBahamas, TheBahrainBangladeshBarbadosBelarusBelgiumBelizeBeninBermudaBhutanBoliviaBosnia and HerzegovinaBotswanaBrazilBritish Virgin IslandsBrunei DarussalamBulgariaBurkina FasoBurundiCabo VerdeCambodiaCameroonCanadaCaribbean small statesCayman IslandsCentral African RepublicCentral Europe and the BalticsChadChileChinaColombiaComorosCongo, Dem. Rep.Congo, Rep.Costa RicaCote d'IvoireCroatiaCubaCuracaoCyprusCzech RepublicDenmarkDjiboutiDominicaDominican RepublicEarly-demographic dividendEast Asia & PacificEast Asia & Pacific (excluding high income)East Asia & Pacific (IDA & IBRD countries)EcuadorEgypt, Arab Rep.El SalvadorEquatorial GuineaEritreaEstoniaEthiopiaEuro areaEurope & Central AsiaEurope & Central Asia (excluding high income)Europe & Central Asia (IDA & IBRD countries)European UnionFaroe IslandsFijiFinlandFragile and conflict affected situationsFranceFrench PolynesiaGabonGambia, TheGeorgiaGermanyGhanaGibraltarGreeceGreenlandGrenadaGuamGuatemalaGuineaGuinea-BissauGuyanaHaitiHeavily indebted poor countries (HIPC)High incomeHondurasHong Kong SAR, ChinaHungaryIBRD onlyIcelandIDA & IBRD totalIDA blendIDA onlyIDA totalIndiaIndonesiaIran, Islamic Rep.IraqIrelandIsraelItalyJamaicaJapanJordanKazakhstanKenyaKiribatiKorea, Dem. People’s Rep.Korea, Rep.KosovoKuwaitKyrgyz RepublicLao PDRLate-demographic dividendLatin America & Caribbean Latin America & Caribbean (excluding high income)Latin America & the Caribbean (IDA & IBRD countries)LatviaLeast developed countries: UN classificationLebanonLesothoLiberiaLibyaLiechtensteinLithuaniaLow & middle incomeLow incomeLower middle incomeLuxembourgMacao SAR, ChinaMacedonia, FYRMadagascarMalawiMalaysiaMaldivesMaliMaltaMarshall IslandsMauritaniaMauritiusMexicoMicronesia, Fed. Sts.Middle East & North AfricaMiddle East & North Africa (excluding high income)Middle East & North Africa (IDA & IBRD countries)Middle incomeMoldovaMonacoMongoliaMontenegroMoroccoMozambiqueMyanmarNamibiaNauruNepalNetherlandsNew CaledoniaNew ZealandNicaraguaNigerNigeriaNorth AmericaNorthern Mariana IslandsNorwayOECD membersOmanOther small statesPacific island small statesPakistanPalauPanamaPapua New GuineaParaguayPeruPhilippinesPolandPortugalPost-demographic dividendPre-demographic dividendPuerto RicoQatarRomaniaRussian FederationRwandaSamoaSan MarinoSao Tome and PrincipeSaudi ArabiaSenegalSerbiaSeychellesSierra LeoneSingaporeSint Maarten (Dutch part)Slovak RepublicSloveniaSmall statesSolomon IslandsSomaliaSouth AfricaSouth AsiaSouth Asia (IDA & IBRD)South SudanSpainSri LankaSt. Kitts and NevisSt. LuciaSt. Vincent and the GrenadinesSub-Saharan Africa Sub-Saharan Africa (excluding high income)Sub-Saharan Africa (IDA & IBRD countries)SudanSurinameSwazilandSwedenSwitzerlandSyrian Arab RepublicTajikistanTanzaniaThailandTimor-LesteTogoTongaTrinidad and TobagoTunisiaTurkeyTurkmenistanTurks and Caicos IslandsTuvaluUgandaUkraineUnited Arab EmiratesUnited KingdomUnited StatesUpper middle incomeUruguayUzbekistanVanuatuVenezuela, RBVietnamVirgin Islands (U.S.)West Bank and GazaWorldYemen, Rep.ZambiaZimbabwe Timeline:
This timeline shows a graph from 1961 to 2016 of Europe & Central Asia. No data until 1960. Number of actual observations by date: 44.
Source name:
World Development Indicators
Source organization:
International Telecommunication Union, World Telecommunication/ICT Development Report and database.
Categories, topics:
Infrastructure
Last updated:
apr 23, 2017
Indicators value changes by year
Maximum:
1.141 bln
jan 1, 2016
At the date of observation
Value
Absolute change
Change from previous value
jan 1, 1981
23.482K
+23.482K
%
jan 1, 1982
50.31K
+26.828K
114.25%
jan 1, 1983
79.375K
+29.065K
57.77%
jan 1, 1984
118.093K
+38.718K
48.78%
jan 1, 1985
179.574K
+61.481K
52.06%
jan 1, 1986
322.211K
+142.637K
79.43%
jan 1, 1987
559.165K
+236.954K
73.54%
jan 1, 1988
952.116K
+392.951K
70.27%
jan 1, 1989
1.58 mln
+628.249K
65.98%
jan 1, 1990
2.495 mln
+915.101K
57.9%
jan 1, 1991
3.455 mln
+959.972K
38.47%
jan 1, 1992
4.724 mln
+1.269 mln
36.71%
jan 1, 1993
6.253 mln
+1.529 mln
32.38%
jan 1, 1994
9.293 mln
+3.039 mln
48.6%
jan 1, 1995
15.157 mln
+5.864 mln
63.1%
jan 1, 1996
24.087 mln
+8.93 mln
58.92%
jan 1, 1997
37.967 mln
+13.88 mln
57.63%
jan 1, 1998
61.012 mln
+23.045 mln
60.7%
jan 1, 1999
104.327 mln
+43.315 mln
70.99%
jan 1, 2000
181.452 mln
+77.125 mln
73.93%
jan 1, 2001
290.864 mln
+109.412 mln
60.3%
jan 1, 2002
358.721 mln
+67.857 mln
23.33%
jan 1, 2003
407.856 mln
+49.135 mln
13.7%
jan 1, 2004
473.112 mln
+65.256 mln
16.0%
jan 1, 2005
576.33 mln
+103.217 mln
21.82%
jan 1, 2006
708.257 mln
+131.927 mln
22.89%
jan 1, 2007
829.272 mln
+121.015 mln
17.09%
jan 1, 2008
935.575 mln
+106.303 mln
12.82%
jan 1, 2009
1.016 bln
+80.421 mln
8.6%
jan 1, 2010
1.059 bln
+42.761 mln
4.21%
jan 1, 2011
1.07 bln
+11.313 mln
1.07%
jan 1, 2012
1.073 bln
+3.074 mln
0.29%
jan 1, 2013
1.096 bln
+23.243 mln
2.17%
jan 1, 2014
1.124 bln
+27.141 mln
2.48%
jan 1, 2015
1.127 bln
+3.921 mln
0.35%
jan 1, 2016
1.141 bln
+13.08 mln
1.16%
Ranking of countries by current statistics by years


Comments: