29
/
en
AIzaSyAYiBZKx7MnpbEhh9jyipgxe19OcubqV5w
April 1, 2024
56421
Small states
SST
false
2
1
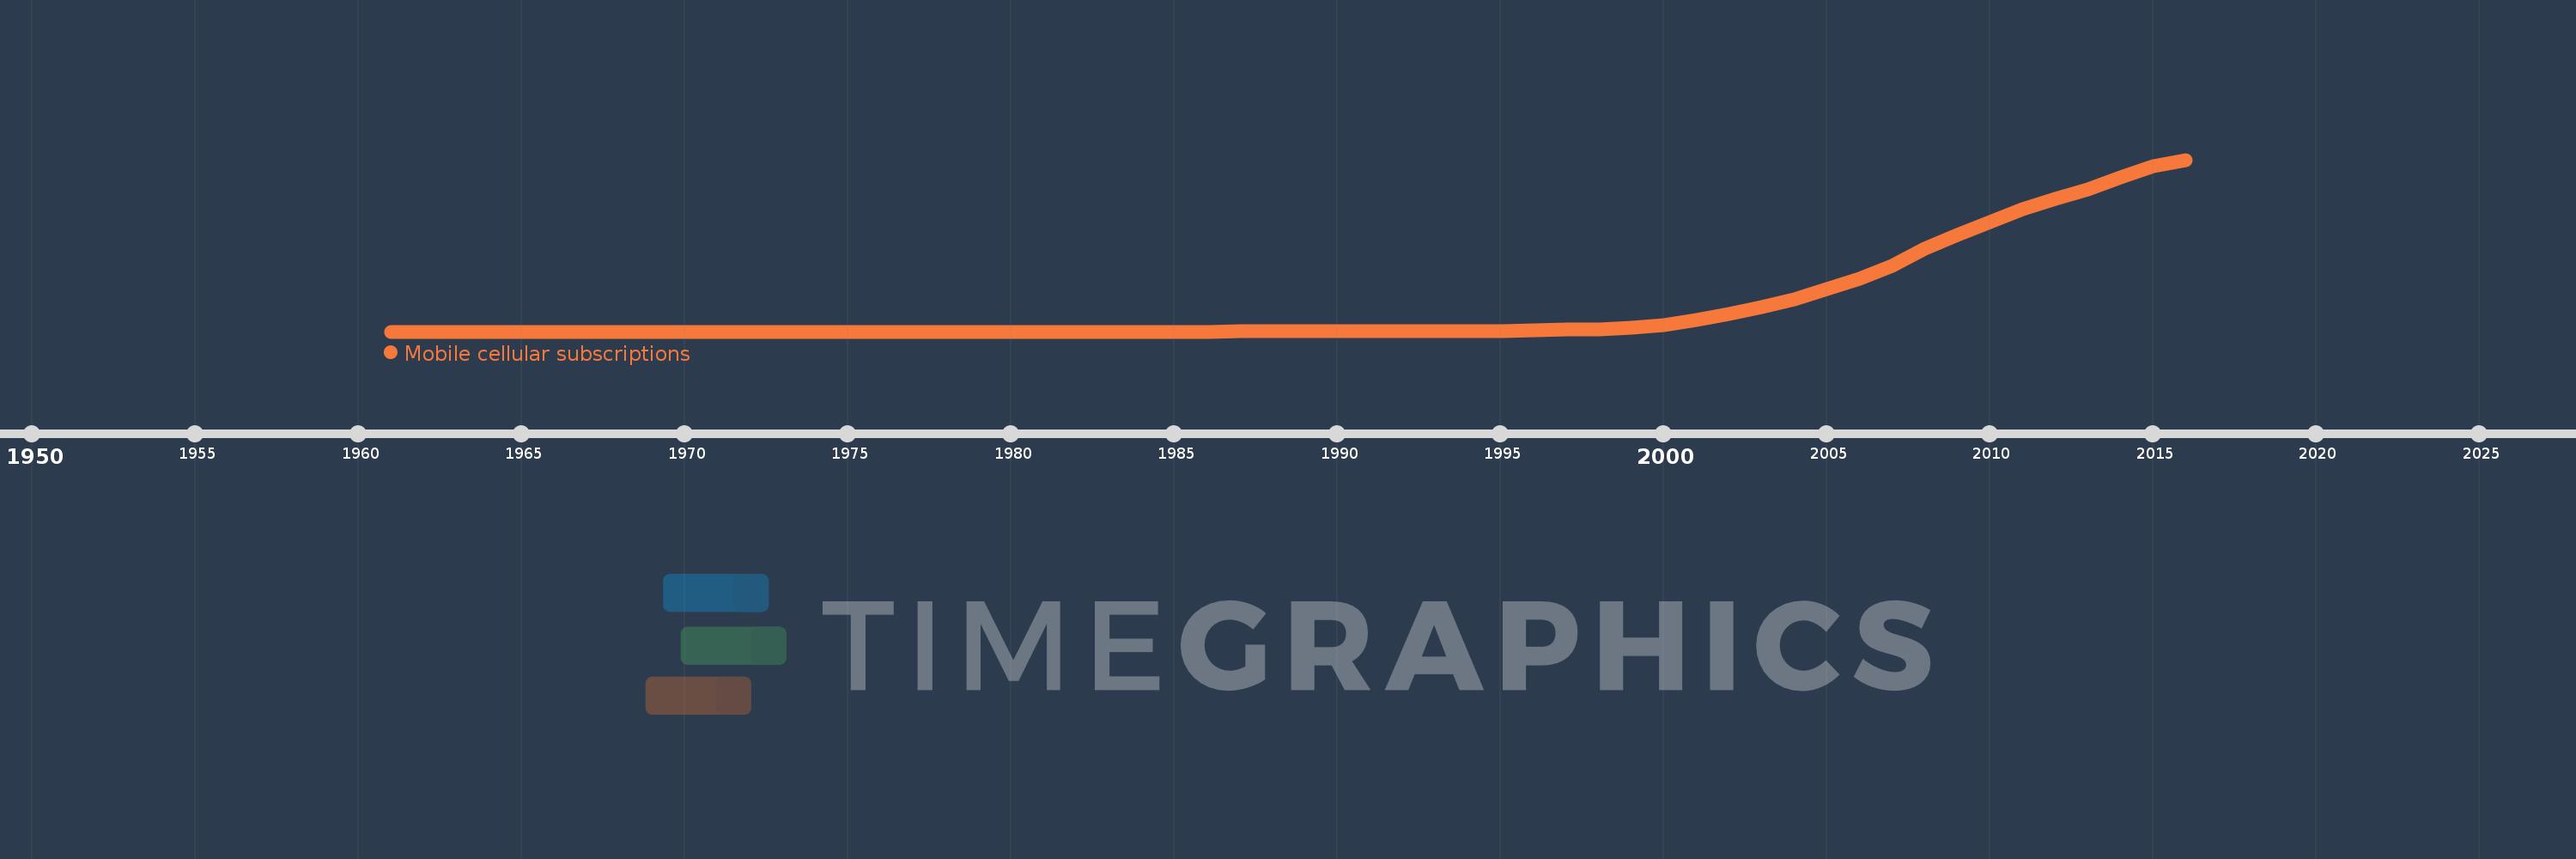
Mobile cellular subscriptions
2016,2015,2014,2013,2012,2011,2010,2009,2008,2007,2006,2005,2004,2003,2002,2001,2000,1999,1998,1997,1996,1995,1994,1993,1992,1991,1990,1989,1988,1987,1986,1985,1984,1983,1982,1981,1980,1979,1978,1977,1976,1971,1966,1961
This statistics in other country:
AfghanistanAlbaniaAlgeriaAmerican SamoaAndorraAngolaAntigua and BarbudaArab WorldArgentinaArmeniaArubaAustraliaAustriaAzerbaijanBahamas, TheBahrainBangladeshBarbadosBelarusBelgiumBelizeBeninBermudaBhutanBoliviaBosnia and HerzegovinaBotswanaBrazilBritish Virgin IslandsBrunei DarussalamBulgariaBurkina FasoBurundiCabo VerdeCambodiaCameroonCanadaCaribbean small statesCayman IslandsCentral African RepublicCentral Europe and the BalticsChadChileChinaColombiaComorosCongo, Dem. Rep.Congo, Rep.Costa RicaCote d'IvoireCroatiaCubaCuracaoCyprusCzech RepublicDenmarkDjiboutiDominicaDominican RepublicEarly-demographic dividendEast Asia & PacificEast Asia & Pacific (excluding high income)East Asia & Pacific (IDA & IBRD countries)EcuadorEgypt, Arab Rep.El SalvadorEquatorial GuineaEritreaEstoniaEthiopiaEuro areaEurope & Central AsiaEurope & Central Asia (excluding high income)Europe & Central Asia (IDA & IBRD countries)European UnionFaroe IslandsFijiFinlandFragile and conflict affected situationsFranceFrench PolynesiaGabonGambia, TheGeorgiaGermanyGhanaGibraltarGreeceGreenlandGrenadaGuamGuatemalaGuineaGuinea-BissauGuyanaHaitiHeavily indebted poor countries (HIPC)High incomeHondurasHong Kong SAR, ChinaHungaryIBRD onlyIcelandIDA & IBRD totalIDA blendIDA onlyIDA totalIndiaIndonesiaIran, Islamic Rep.IraqIrelandIsraelItalyJamaicaJapanJordanKazakhstanKenyaKiribatiKorea, Dem. People’s Rep.Korea, Rep.KosovoKuwaitKyrgyz RepublicLao PDRLate-demographic dividendLatin America & Caribbean Latin America & Caribbean (excluding high income)Latin America & the Caribbean (IDA & IBRD countries)LatviaLeast developed countries: UN classificationLebanonLesothoLiberiaLibyaLiechtensteinLithuaniaLow & middle incomeLow incomeLower middle incomeLuxembourgMacao SAR, ChinaMacedonia, FYRMadagascarMalawiMalaysiaMaldivesMaliMaltaMarshall IslandsMauritaniaMauritiusMexicoMicronesia, Fed. Sts.Middle East & North AfricaMiddle East & North Africa (excluding high income)Middle East & North Africa (IDA & IBRD countries)Middle incomeMoldovaMonacoMongoliaMontenegroMoroccoMozambiqueMyanmarNamibiaNauruNepalNetherlandsNew CaledoniaNew ZealandNicaraguaNigerNigeriaNorth AmericaNorthern Mariana IslandsNorwayOECD membersOmanOther small statesPacific island small statesPakistanPalauPanamaPapua New GuineaParaguayPeruPhilippinesPolandPortugalPost-demographic dividendPre-demographic dividendPuerto RicoQatarRomaniaRussian FederationRwandaSamoaSan MarinoSao Tome and PrincipeSaudi ArabiaSenegalSerbiaSeychellesSierra LeoneSingaporeSint Maarten (Dutch part)Slovak RepublicSloveniaSmall statesSolomon IslandsSomaliaSouth AfricaSouth AsiaSouth Asia (IDA & IBRD)South SudanSpainSri LankaSt. Kitts and NevisSt. LuciaSt. Vincent and the GrenadinesSub-Saharan Africa Sub-Saharan Africa (excluding high income)Sub-Saharan Africa (IDA & IBRD countries)SudanSurinameSwazilandSwedenSwitzerlandSyrian Arab RepublicTajikistanTanzaniaThailandTimor-LesteTogoTongaTrinidad and TobagoTunisiaTurkeyTurkmenistanTurks and Caicos IslandsTuvaluUgandaUkraineUnited Arab EmiratesUnited KingdomUnited StatesUpper middle incomeUruguayUzbekistanVanuatuVenezuela, RBVietnamVirgin Islands (U.S.)West Bank and GazaWorldYemen, Rep.ZambiaZimbabwe Timeline:
This timeline shows a graph from 1961 to 2016 of Small states. No data until 1960. Number of actual observations by date: 44.
Source name:
World Development Indicators
Source organization:
International Telecommunication Union, World Telecommunication/ICT Development Report and database.
Categories, topics:
Infrastructure
Last updated:
apr 23, 2017
Indicators value changes by year
Maximum:
44.361 mln
jan 1, 2016
At the date of observation
Value
Absolute change
Change from previous value
jan 1, 1987
3.26K
+3.26K
%
jan 1, 1988
6.72K
+3.46K
106.13%
jan 1, 1989
9.573K
+2.853K
42.46%
jan 1, 1990
13.492K
+3.919K
40.94%
jan 1, 1991
28.168K
+14.676K
108.78%
jan 1, 1992
43.332K
+15.164K
53.83%
jan 1, 1993
66.696K
+23.364K
53.92%
jan 1, 1994
100.051K
+33.355K
50.01%
jan 1, 1995
160.027K
+59.976K
59.95%
jan 1, 1996
291.508K
+131.481K
82.16%
jan 1, 1997
445.094K
+153.586K
52.69%
jan 1, 1998
662.205K
+217.111K
48.78%
jan 1, 1999
989.31K
+327.105K
49.4%
jan 1, 2000
1.626 mln
+636.307K
64.32%
jan 1, 2001
3.045 mln
+1.419 mln
87.31%
jan 1, 2002
4.531 mln
+1.486 mln
48.8%
jan 1, 2003
6.415 mln
+1.884 mln
41.58%
jan 1, 2004
8.23 mln
+1.815 mln
28.3%
jan 1, 2005
11.028 mln
+2.798 mln
34.0%
jan 1, 2006
13.558 mln
+2.53 mln
22.94%
jan 1, 2007
17.043 mln
+3.485 mln
25.71%
jan 1, 2008
21.297 mln
+4.254 mln
24.96%
jan 1, 2009
24.963 mln
+3.665 mln
17.21%
jan 1, 2010
28.292 mln
+3.329 mln
13.34%
jan 1, 2011
31.664 mln
+3.372 mln
11.92%
jan 1, 2012
34.294 mln
+2.63 mln
8.31%
jan 1, 2013
36.77 mln
+2.476 mln
7.22%
jan 1, 2014
39.846 mln
+3.077 mln
8.37%
jan 1, 2015
42.692 mln
+2.846 mln
7.14%
jan 1, 2016
44.361 mln
+1.669 mln
3.91%
Ranking of countries by current statistics by years


Comments: