29
/
en
AIzaSyAYiBZKx7MnpbEhh9jyipgxe19OcubqV5w
April 1, 2024
62820
World
WLD
false
2
1
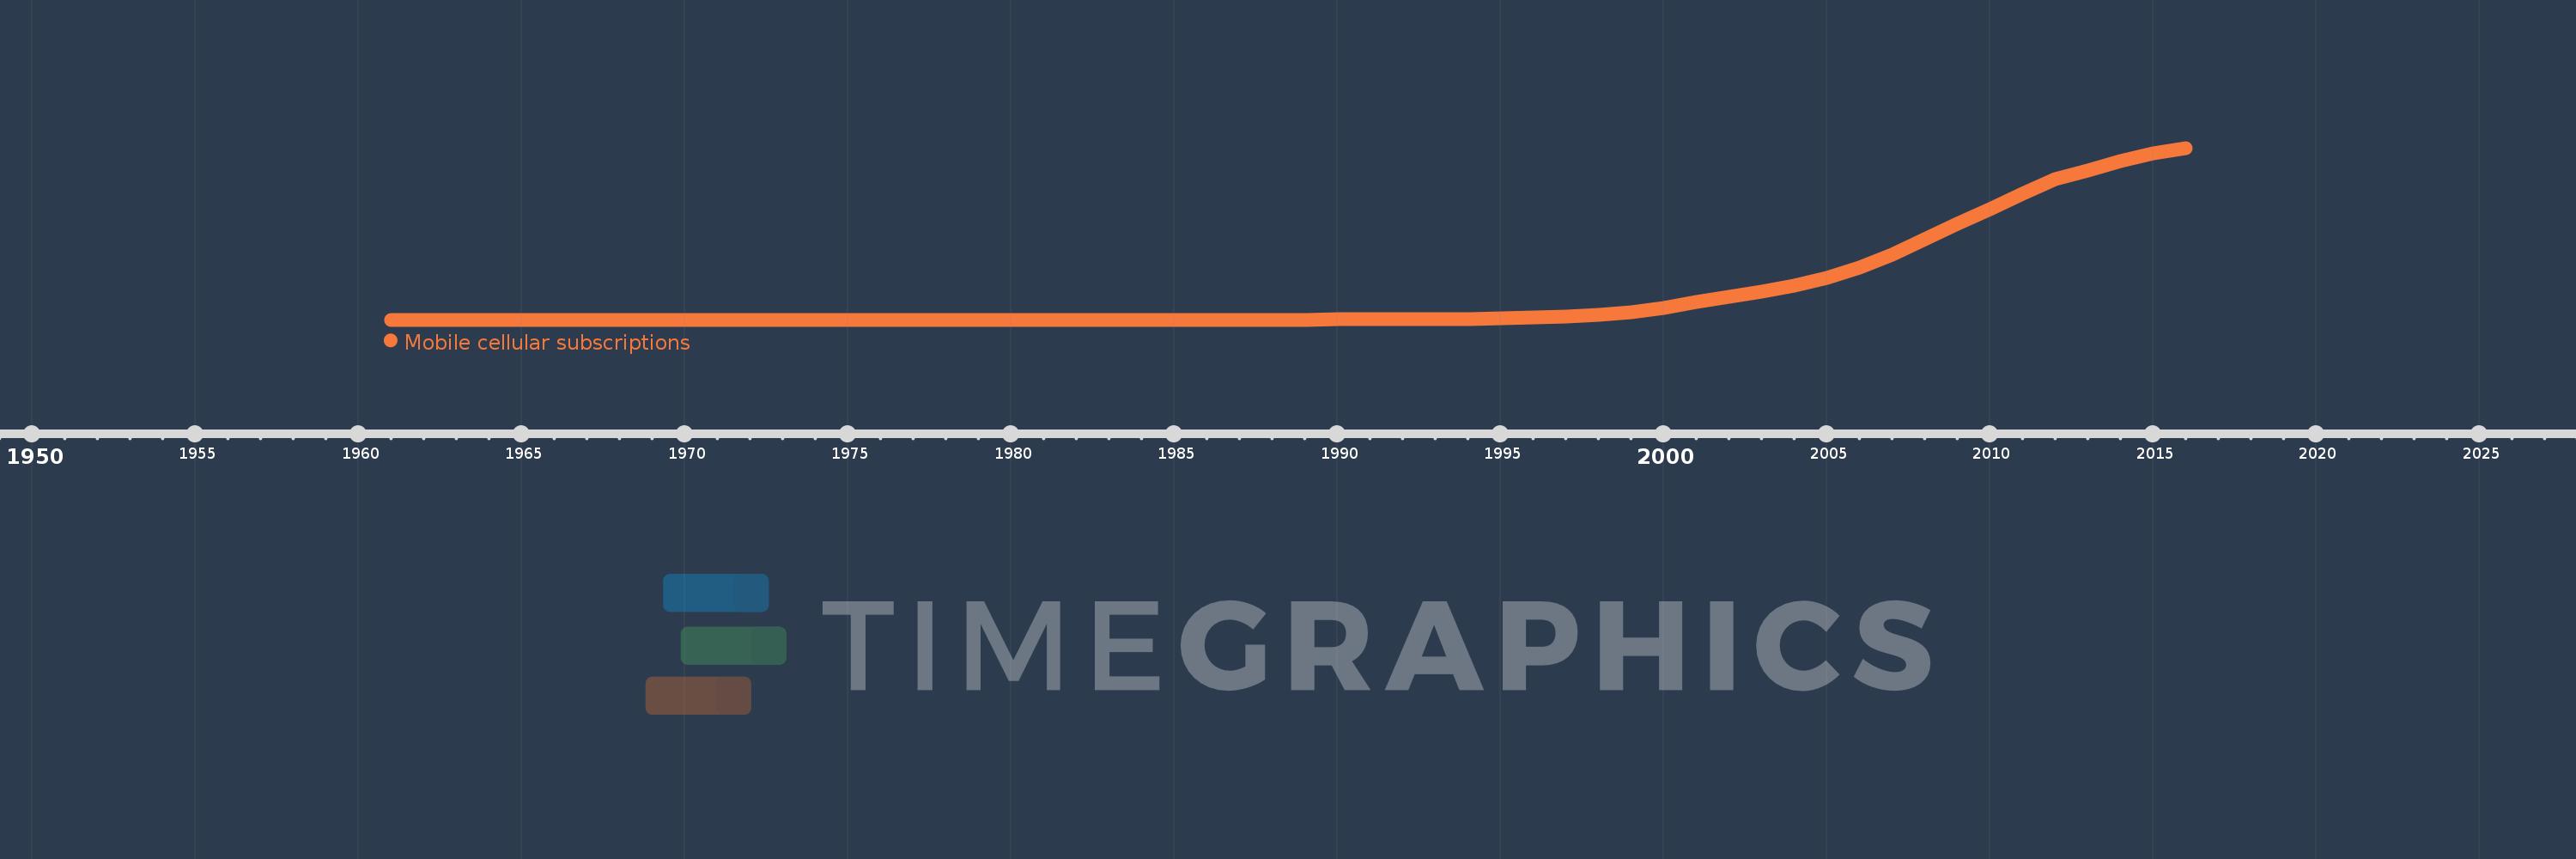
Mobile cellular subscriptions
2016,2015,2014,2013,2012,2011,2010,2009,2008,2007,2006,2005,2004,2003,2002,2001,2000,1999,1998,1997,1996,1995,1994,1993,1992,1991,1990,1989,1988,1987,1986,1985,1984,1983,1982,1981,1980,1979,1978,1977,1976,1971,1966,1961
This statistics in other country:
AfghanistanAlbaniaAlgeriaAmerican SamoaAndorraAngolaAntigua and BarbudaArab WorldArgentinaArmeniaArubaAustraliaAustriaAzerbaijanBahamas, TheBahrainBangladeshBarbadosBelarusBelgiumBelizeBeninBermudaBhutanBoliviaBosnia and HerzegovinaBotswanaBrazilBritish Virgin IslandsBrunei DarussalamBulgariaBurkina FasoBurundiCabo VerdeCambodiaCameroonCanadaCaribbean small statesCayman IslandsCentral African RepublicCentral Europe and the BalticsChadChileChinaColombiaComorosCongo, Dem. Rep.Congo, Rep.Costa RicaCote d'IvoireCroatiaCubaCuracaoCyprusCzech RepublicDenmarkDjiboutiDominicaDominican RepublicEarly-demographic dividendEast Asia & PacificEast Asia & Pacific (excluding high income)East Asia & Pacific (IDA & IBRD countries)EcuadorEgypt, Arab Rep.El SalvadorEquatorial GuineaEritreaEstoniaEthiopiaEuro areaEurope & Central AsiaEurope & Central Asia (excluding high income)Europe & Central Asia (IDA & IBRD countries)European UnionFaroe IslandsFijiFinlandFragile and conflict affected situationsFranceFrench PolynesiaGabonGambia, TheGeorgiaGermanyGhanaGibraltarGreeceGreenlandGrenadaGuamGuatemalaGuineaGuinea-BissauGuyanaHaitiHeavily indebted poor countries (HIPC)High incomeHondurasHong Kong SAR, ChinaHungaryIBRD onlyIcelandIDA & IBRD totalIDA blendIDA onlyIDA totalIndiaIndonesiaIran, Islamic Rep.IraqIrelandIsraelItalyJamaicaJapanJordanKazakhstanKenyaKiribatiKorea, Dem. People’s Rep.Korea, Rep.KosovoKuwaitKyrgyz RepublicLao PDRLate-demographic dividendLatin America & Caribbean Latin America & Caribbean (excluding high income)Latin America & the Caribbean (IDA & IBRD countries)LatviaLeast developed countries: UN classificationLebanonLesothoLiberiaLibyaLiechtensteinLithuaniaLow & middle incomeLow incomeLower middle incomeLuxembourgMacao SAR, ChinaMacedonia, FYRMadagascarMalawiMalaysiaMaldivesMaliMaltaMarshall IslandsMauritaniaMauritiusMexicoMicronesia, Fed. Sts.Middle East & North AfricaMiddle East & North Africa (excluding high income)Middle East & North Africa (IDA & IBRD countries)Middle incomeMoldovaMonacoMongoliaMontenegroMoroccoMozambiqueMyanmarNamibiaNauruNepalNetherlandsNew CaledoniaNew ZealandNicaraguaNigerNigeriaNorth AmericaNorthern Mariana IslandsNorwayOECD membersOmanOther small statesPacific island small statesPakistanPalauPanamaPapua New GuineaParaguayPeruPhilippinesPolandPortugalPost-demographic dividendPre-demographic dividendPuerto RicoQatarRomaniaRussian FederationRwandaSamoaSan MarinoSao Tome and PrincipeSaudi ArabiaSenegalSerbiaSeychellesSierra LeoneSingaporeSint Maarten (Dutch part)Slovak RepublicSloveniaSmall statesSolomon IslandsSomaliaSouth AfricaSouth AsiaSouth Asia (IDA & IBRD)South SudanSpainSri LankaSt. Kitts and NevisSt. LuciaSt. Vincent and the GrenadinesSub-Saharan Africa Sub-Saharan Africa (excluding high income)Sub-Saharan Africa (IDA & IBRD countries)SudanSurinameSwazilandSwedenSwitzerlandSyrian Arab RepublicTajikistanTanzaniaThailandTimor-LesteTogoTongaTrinidad and TobagoTunisiaTurkeyTurkmenistanTurks and Caicos IslandsTuvaluUgandaUkraineUnited Arab EmiratesUnited KingdomUnited StatesUpper middle incomeUruguayUzbekistanVanuatuVenezuela, RBVietnamVirgin Islands (U.S.)West Bank and GazaWorldYemen, Rep.ZambiaZimbabwe Timeline:
This timeline shows a graph from 1961 to 2016 of World. No data until 1960. Number of actual observations by date: 44.
Source name:
World Development Indicators
Source organization:
International Telecommunication Union, World Telecommunication/ICT Development Report and database.
Categories, topics:
Infrastructure
Last updated:
apr 23, 2017
Indicators value changes by year
Maximum:
7.216 bln
jan 1, 2016
At the date of observation
Value
Absolute change
Change from previous value
jan 1, 1981
23.482K
+23.482K
%
jan 1, 1982
63.585K
+40.103K
170.78%
jan 1, 1983
101.509K
+37.924K
59.64%
jan 1, 1984
148.855K
+47.346K
46.64%
jan 1, 1985
319.252K
+170.397K
114.47%
jan 1, 1986
750.629K
+431.377K
135.12%
jan 1, 1987
1.45 mln
+699.507K
93.19%
jan 1, 1988
2.545 mln
+1.095 mln
75.52%
jan 1, 1989
4.328 mln
+1.783 mln
70.04%
jan 1, 1990
7.353 mln
+3.025 mln
69.9%
jan 1, 1991
11.21 mln
+3.857 mln
52.45%
jan 1, 1992
16.277 mln
+5.066 mln
45.19%
jan 1, 1993
23.245 mln
+6.969 mln
42.81%
jan 1, 1994
34.163 mln
+10.918 mln
46.97%
jan 1, 1995
55.512 mln
+21.348 mln
62.49%
jan 1, 1996
90.744 mln
+35.232 mln
63.47%
jan 1, 1997
145.042 mln
+54.299 mln
59.84%
jan 1, 1998
214.953 mln
+69.911 mln
48.2%
jan 1, 1999
318.097 mln
+103.144 mln
47.98%
jan 1, 2000
490.984 mln
+172.887 mln
54.35%
jan 1, 2001
738.158 mln
+247.174 mln
50.34%
jan 1, 2002
960.983 mln
+222.825 mln
30.19%
jan 1, 2003
1.164 bln
+203.295 mln
21.15%
jan 1, 2004
1.415 bln
+250.75 mln
21.54%
jan 1, 2005
1.761 bln
+345.968 mln
24.45%
jan 1, 2006
2.206 bln
+444.854 mln
25.26%
jan 1, 2007
2.745 bln
+539.309 mln
24.45%
jan 1, 2008
3.369 bln
+623.575 mln
22.72%
jan 1, 2009
4.029 bln
+659.947 mln
19.59%
jan 1, 2010
4.636 bln
+607.555 mln
15.08%
jan 1, 2011
5.296 bln
+659.395 mln
14.22%
jan 1, 2012
5.89 bln
+594.122 mln
11.22%
jan 1, 2013
6.261 bln
+371.097 mln
6.3%
jan 1, 2014
6.663 bln
+401.708 mln
6.42%
jan 1, 2015
7.006 bln
+343.258 mln
5.15%
jan 1, 2016
7.216 bln
+209.898 mln
3.0%
Ranking of countries by current statistics by years


Comments: