29
/
en
AIzaSyAYiBZKx7MnpbEhh9jyipgxe19OcubqV5w
April 1, 2024
35675
High income
HIC
false
2
1
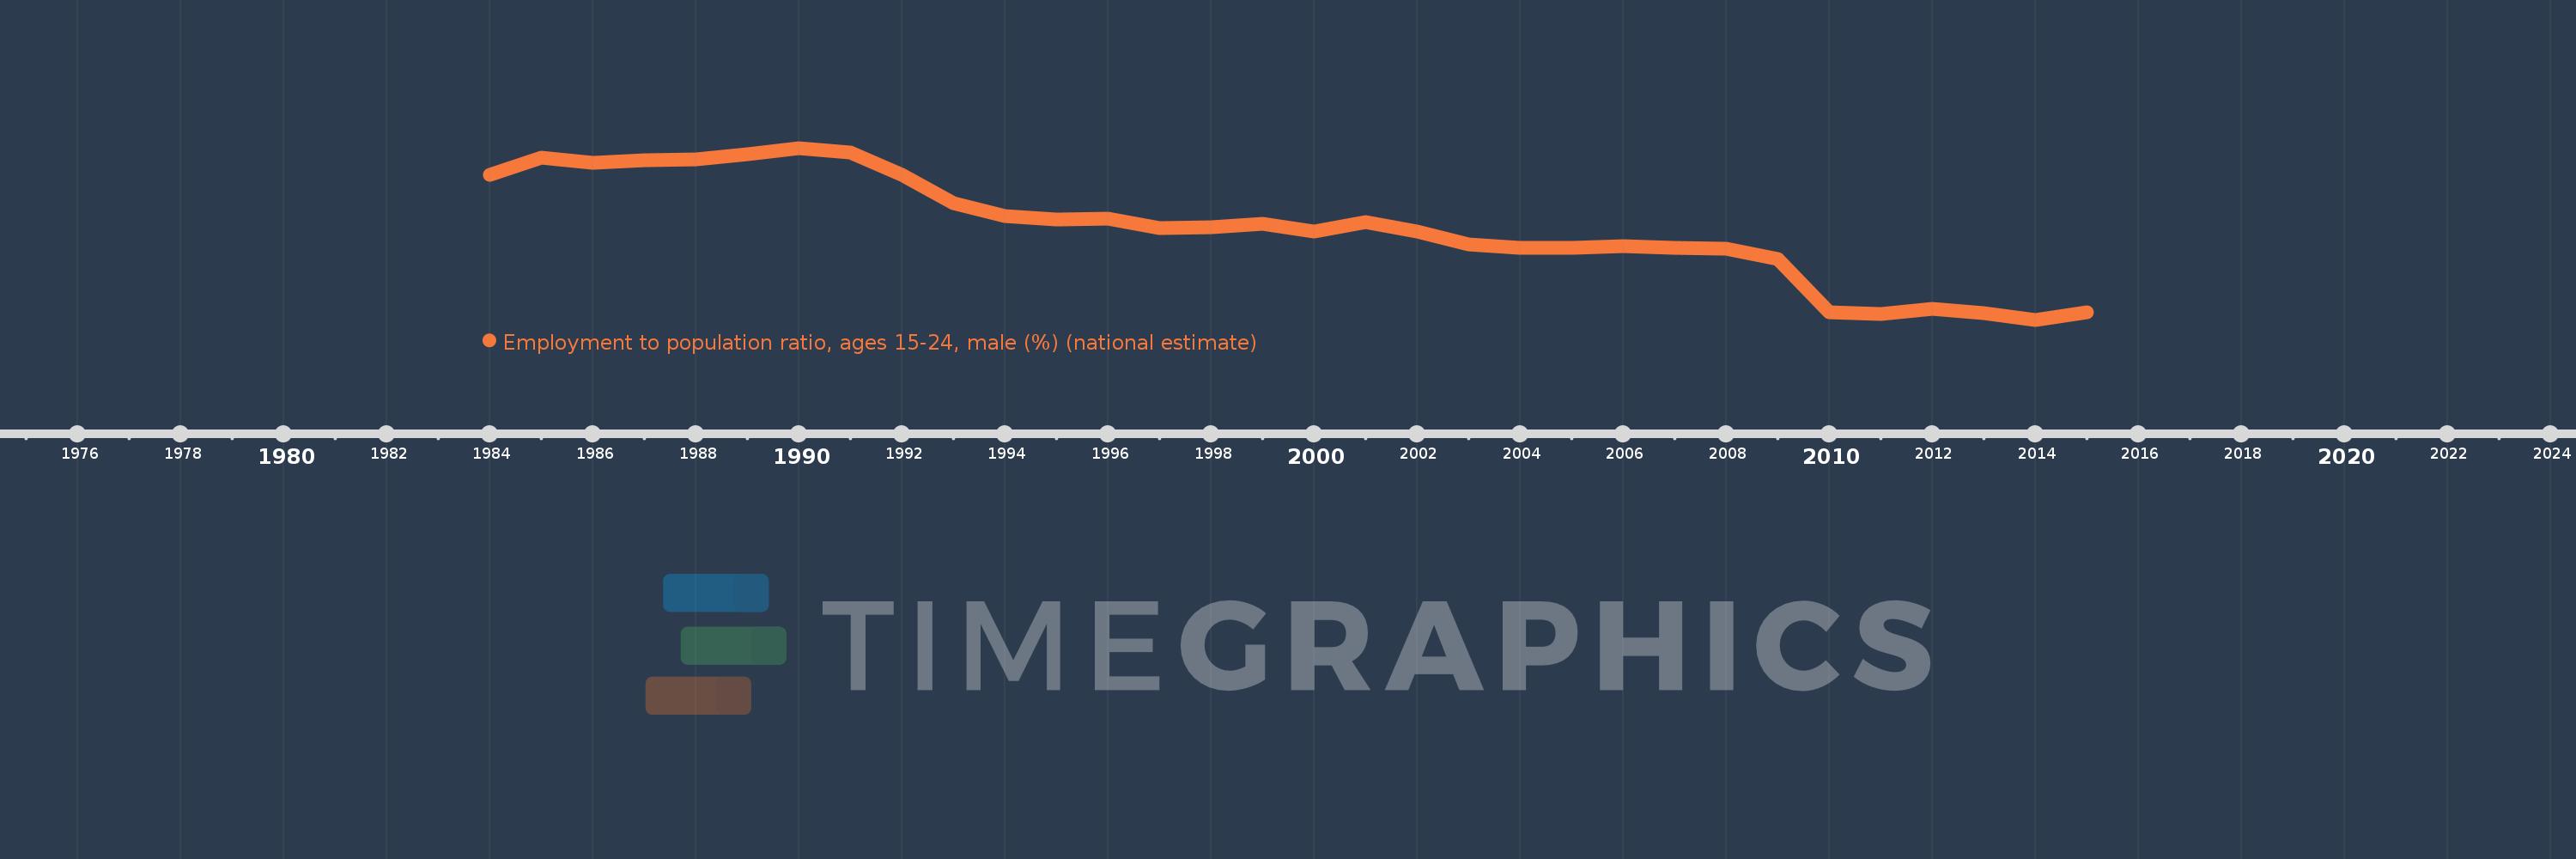
Employment to population ratio, ages 15-24, male (%) (national estimate)
2015,2014,2013,2012,2011,2010,2009,2008,2007,2006,2005,2004,2003,2002,2001,2000,1999,1998,1997,1996,1995,1994,1993,1992,1991,1990,1989,1988,1987,1986,1985,1984
This statistics in other country:
Timeline:
This timeline shows a graph from 1984 to 2015 of High income. No data until 1983. Number of actual observations by date: 32.
Source name:
World Development Indicators
Source organization:
International Labour Organization, Key Indicators of the Labour Market database.
Categories, topics:
Social Protection & Labor
Last updated:
apr 23, 2017
Indicators value changes by year
Minimum:
39.558
jan 1, 2014
Maximum:
52.211
jan 1, 1990
At the date of observation
Value
Absolute change
Change from previous value
jan 1, 1984
50.242
+50.242
0.0%
jan 1, 1985
51.484
+1.241
2.47%
jan 1, 1986
51.143
-0.341
-0.66%
jan 1, 1987
51.284
+0.141
0.28%
jan 1, 1988
51.361
+0.077
0.15%
jan 1, 1989
51.739
+0.378
0.74%
jan 1, 1990
52.211
+0.473
0.91%
jan 1, 1991
51.877
-0.334
-0.64%
jan 1, 1992
50.255
-1.622
-3.13%
jan 1, 1993
48.152
-2.103
-4.18%
jan 1, 1994
47.169
-0.983
-2.04%
jan 1, 1995
46.963
-0.206
-0.44%
jan 1, 1996
47.009
+0.046
0.1%
jan 1, 1997
46.333
-0.677
-1.44%
jan 1, 1998
46.369
+0.036
0.08%
jan 1, 1999
46.599
+0.23
0.5%
jan 1, 2000
46.068
-0.531
-1.14%
jan 1, 2001
46.726
+0.659
1.43%
jan 1, 2002
46.039
-0.688
-1.47%
jan 1, 2003
45.129
-0.909
-1.98%
jan 1, 2004
44.866
-0.263
-0.58%
jan 1, 2005
44.86
-0.006
-0.01%
jan 1, 2006
44.958
+0.098
0.22%
jan 1, 2007
44.878
-0.08
-0.18%
jan 1, 2008
44.762
-0.116
-0.26%
jan 1, 2009
44.003
-0.759
-1.69%
jan 1, 2010
40.135
-3.868
-8.79%
jan 1, 2011
39.992
-0.144
-0.36%
jan 1, 2012
40.383
+0.391
0.98%
jan 1, 2013
40.041
-0.342
-0.85%
jan 1, 2014
39.558
-0.483
-1.21%
jan 1, 2015
40.104
+0.546
1.38%
Ranking of countries by current statistics by years


Comments: