29
/
en
AIzaSyAYiBZKx7MnpbEhh9jyipgxe19OcubqV5w
April 1, 2024
117816
Czech Republic
CZE
true
2
1
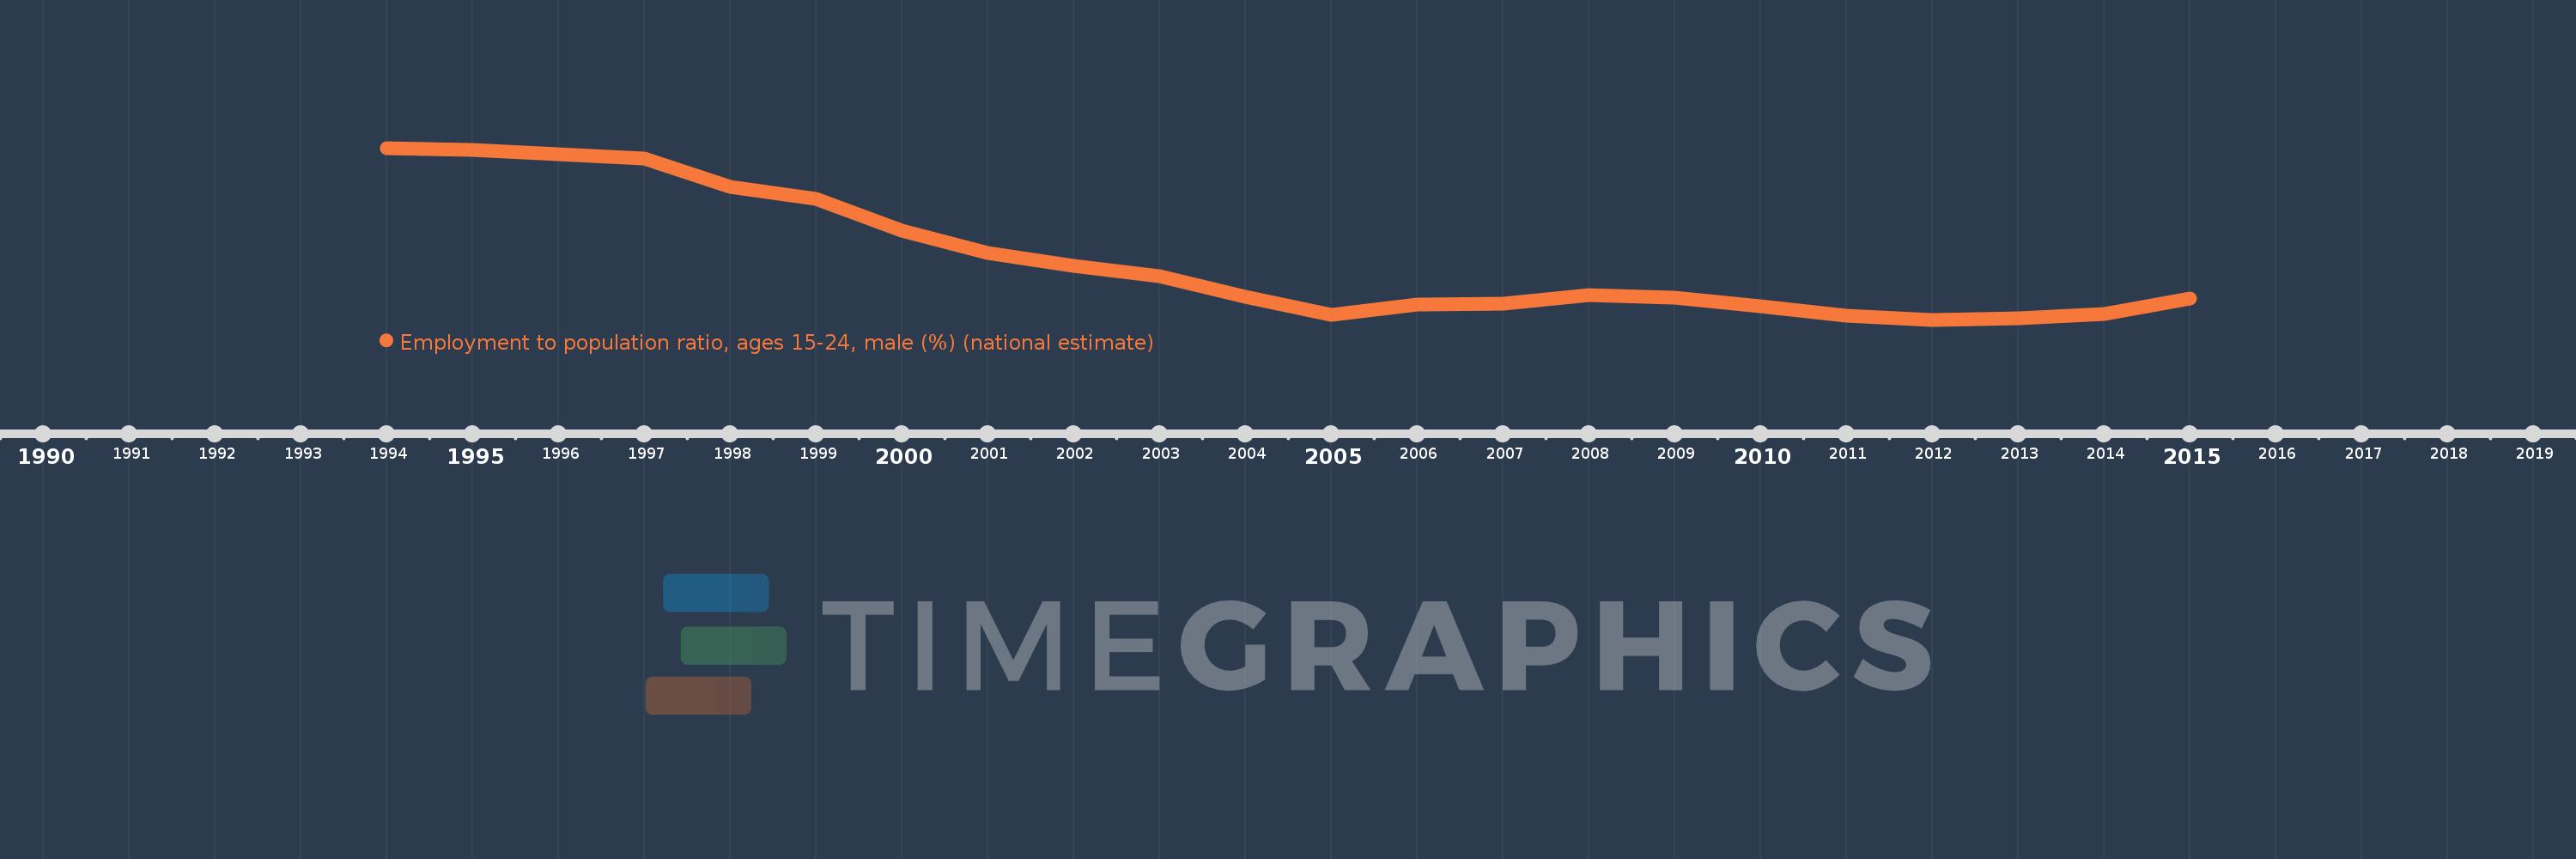
Employment to population ratio, ages 15-24, male (%) (national estimate)
2015,2014,2013,2012,2011,2010,2009,2008,2007,2006,2005,2004,2003,2002,2001,2000,1999,1998,1997,1996,1995,1994
This statistics in other country:
Timeline:
This timeline shows a graph from 1994 to 2015 of Czech Republic. No data until 1993. Number of actual observations by date: 22.
Source name:
World Development Indicators
Source organization:
International Labour Organization, Key Indicators of the Labour Market database.
Categories, topics:
Social Protection & Labor
Last updated:
apr 23, 2017
Indicators value changes by year
At the date of observation
Value
Absolute change
Change from previous value
jan 1, 1994
55.5
+55.5
0.0%
jan 1, 1995
55.2
-0.3
-0.54%
jan 1, 1996
54.5
-0.7
-1.27%
jan 1, 1997
53.9
-0.6
-1.1%
jan 1, 1998
49.5
-4.4
-8.16%
jan 1, 1999
47.6
-1.9
-3.84%
jan 1, 2000
42.7
-4.9
-10.29%
jan 1, 2001
39.3
-3.4
-7.96%
jan 1, 2002
37.3
-2.0
-5.09%
jan 1, 2003
35.7
-1.6
-4.29%
jan 1, 2004
32.5
-3.2
-8.96%
jan 1, 2005
29.7
-2.8
-8.62%
jan 1, 2006
31.3
+1.6
5.39%
jan 1, 2007
31.5
+0.2
0.64%
jan 1, 2008
32.8
+1.3
4.13%
jan 1, 2009
32.4
-0.4
-1.22%
jan 1, 2010
31.1
-1.3
-4.01%
jan 1, 2011
29.6
-1.5
-4.82%
jan 1, 2012
29.0
-0.6
-2.03%
jan 1, 2013
29.2
+0.2
0.69%
jan 1, 2014
29.9
+0.7
2.4%
jan 1, 2015
32.3
+2.4
8.03%
Ranking of countries by current statistics by years


Comments: