29
/
en
AIzaSyAYiBZKx7MnpbEhh9jyipgxe19OcubqV5w
April 1, 2024
163682
Japan
JPN
true
2
1
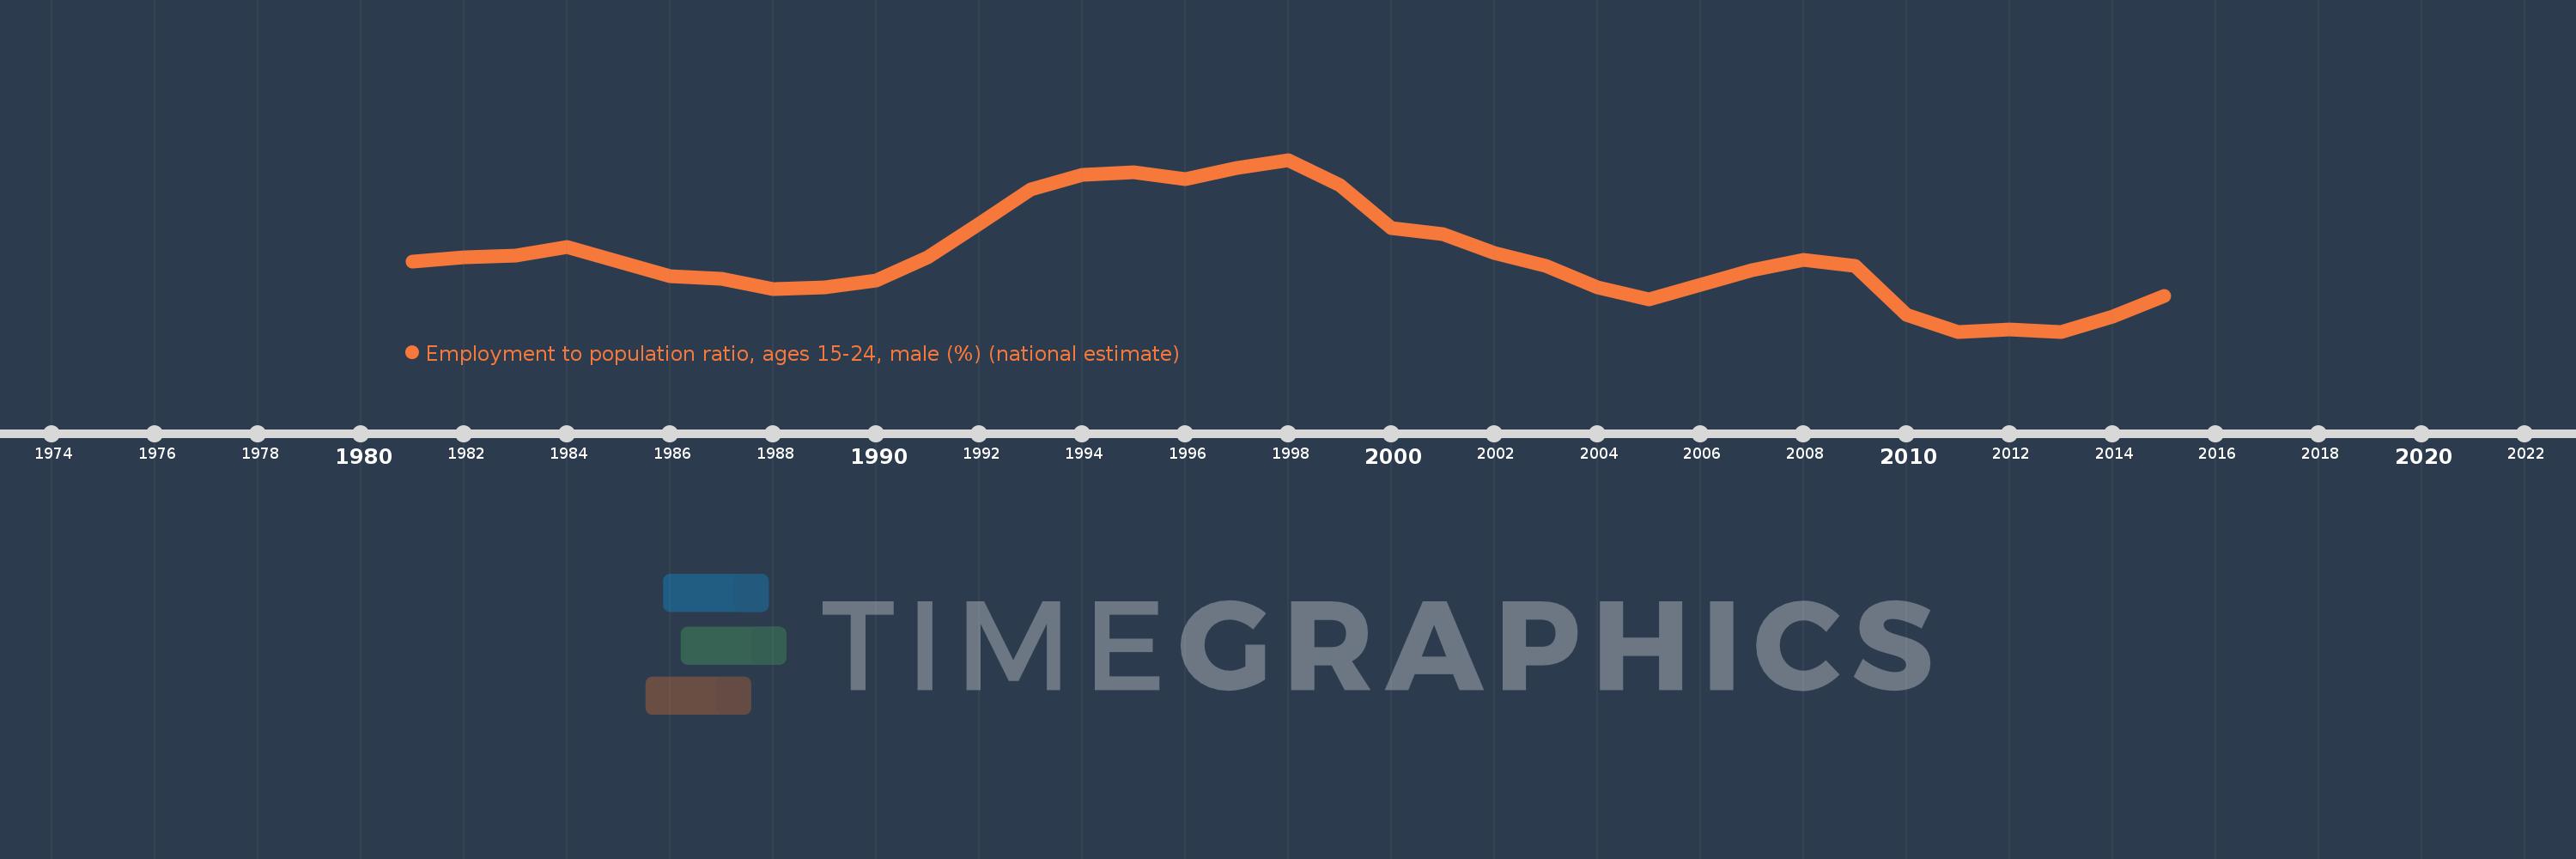
Employment to population ratio, ages 15-24, male (%) (national estimate)
2015,2014,2013,2012,2011,2010,2009,2008,2007,2006,2005,2004,2003,2002,2001,2000,1999,1998,1997,1996,1995,1994,1993,1992,1991,1990,1989,1988,1987,1986,1985,1984,1983,1982,1981
This statistics in other country:
Timeline:
This timeline shows a graph from 1981 to 2015 of Japan. No data until 1980. Number of actual observations by date: 35.
Source name:
World Development Indicators
Source organization:
International Labour Organization, Key Indicators of the Labour Market database.
Categories, topics:
Social Protection & Labor
Last updated:
apr 23, 2017
Indicators value changes by year
At the date of observation
Value
Absolute change
Change from previous value
jan 1, 1981
41.2
+41.2
0.0%
jan 1, 1982
41.4
+0.2
0.49%
jan 1, 1983
41.5
+0.1
0.24%
jan 1, 1984
41.9
+0.4
0.96%
jan 1, 1985
41.2
-0.7
-1.67%
jan 1, 1986
40.5
-0.7
-1.7%
jan 1, 1987
40.4
-0.1
-0.25%
jan 1, 1988
39.9
-0.5
-1.24%
jan 1, 1989
40.0
+0.1
0.25%
jan 1, 1990
40.3
+0.3
0.75%
jan 1, 1991
41.4
+1.1
2.73%
jan 1, 1992
43.0
+1.6
3.86%
jan 1, 1993
44.6
+1.6
3.72%
jan 1, 1994
45.3
+0.7
1.57%
jan 1, 1995
45.4
+0.1
0.22%
jan 1, 1996
45.1
-0.3
-0.66%
jan 1, 1997
45.6
+0.5
1.11%
jan 1, 1998
46.0
+0.4
0.88%
jan 1, 1999
44.8
-1.2
-2.61%
jan 1, 2000
42.8
-2.0
-4.46%
jan 1, 2001
42.5
-0.3
-0.7%
jan 1, 2002
41.6
-0.9
-2.12%
jan 1, 2003
41.0
-0.6
-1.44%
jan 1, 2004
40.0
-1.0
-2.44%
jan 1, 2005
39.4
-0.6
-1.5%
jan 1, 2006
40.1
+0.7
1.78%
jan 1, 2007
40.8
+0.7
1.75%
jan 1, 2008
41.3
+0.5
1.23%
jan 1, 2009
41.0
-0.3
-0.73%
jan 1, 2010
38.7
-2.3
-5.61%
jan 1, 2011
37.9
-0.8
-2.07%
jan 1, 2012
38.0
+0.1
0.26%
jan 1, 2013
37.9
-0.1
-0.26%
jan 1, 2014
38.6
+0.7
1.85%
jan 1, 2015
39.6
+1.0
2.59%
Ranking of countries by current statistics by years


Comments: