29
/
en
AIzaSyAYiBZKx7MnpbEhh9jyipgxe19OcubqV5w
April 1, 2024
31515
Europe & Central Asia (excluding high income)
ECA
false
2
1
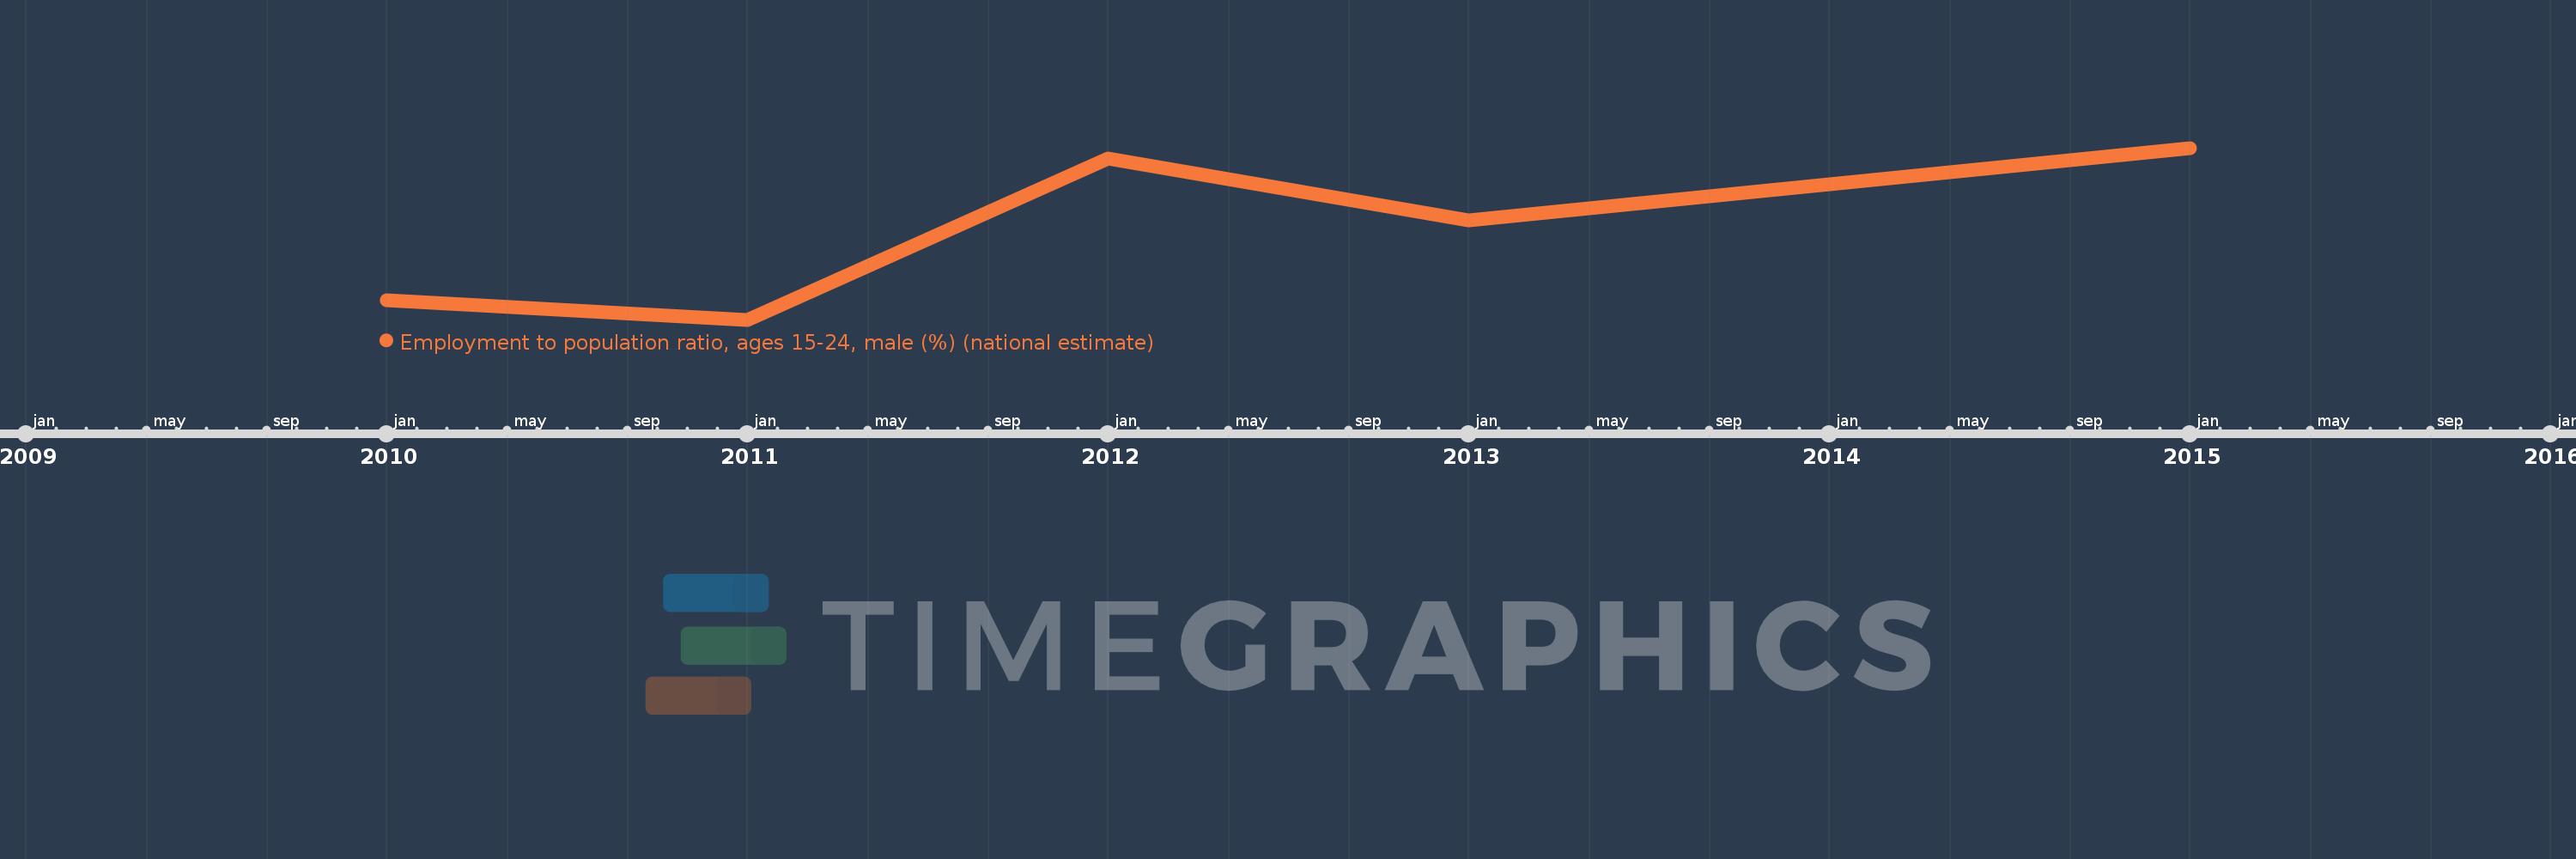
Employment to population ratio, ages 15-24, male (%) (national estimate)
2015,2013,2012,2011,2010
This statistics in other country:
Timeline:
This timeline shows a graph from 2010 to 2015 of Europe & Central Asia (excluding high income). No data until 2009. Number of actual observations by date: 5.
Source name:
World Development Indicators
Source organization:
International Labour Organization, Key Indicators of the Labour Market database.
Categories, topics:
Social Protection & Labor
Last updated:
apr 23, 2017
Indicators value changes by year
Minimum:
36.653
jan 1, 2011
Maximum:
38.141
jan 1, 2015
At the date of observation
Value
Absolute change
Change from previous value
jan 1, 2010
36.823
+36.823
0.0%
jan 1, 2011
36.653
-0.169
-0.46%
jan 1, 2012
38.047
+1.394
3.8%
jan 1, 2013
37.516
-0.531
-1.4%
jan 1, 2015
38.141
+0.625
1.67%
Ranking of countries by current statistics by years


Comments: