29
/
en
AIzaSyAYiBZKx7MnpbEhh9jyipgxe19OcubqV5w
April 1, 2024
35521
High income
HIC
false
2
1
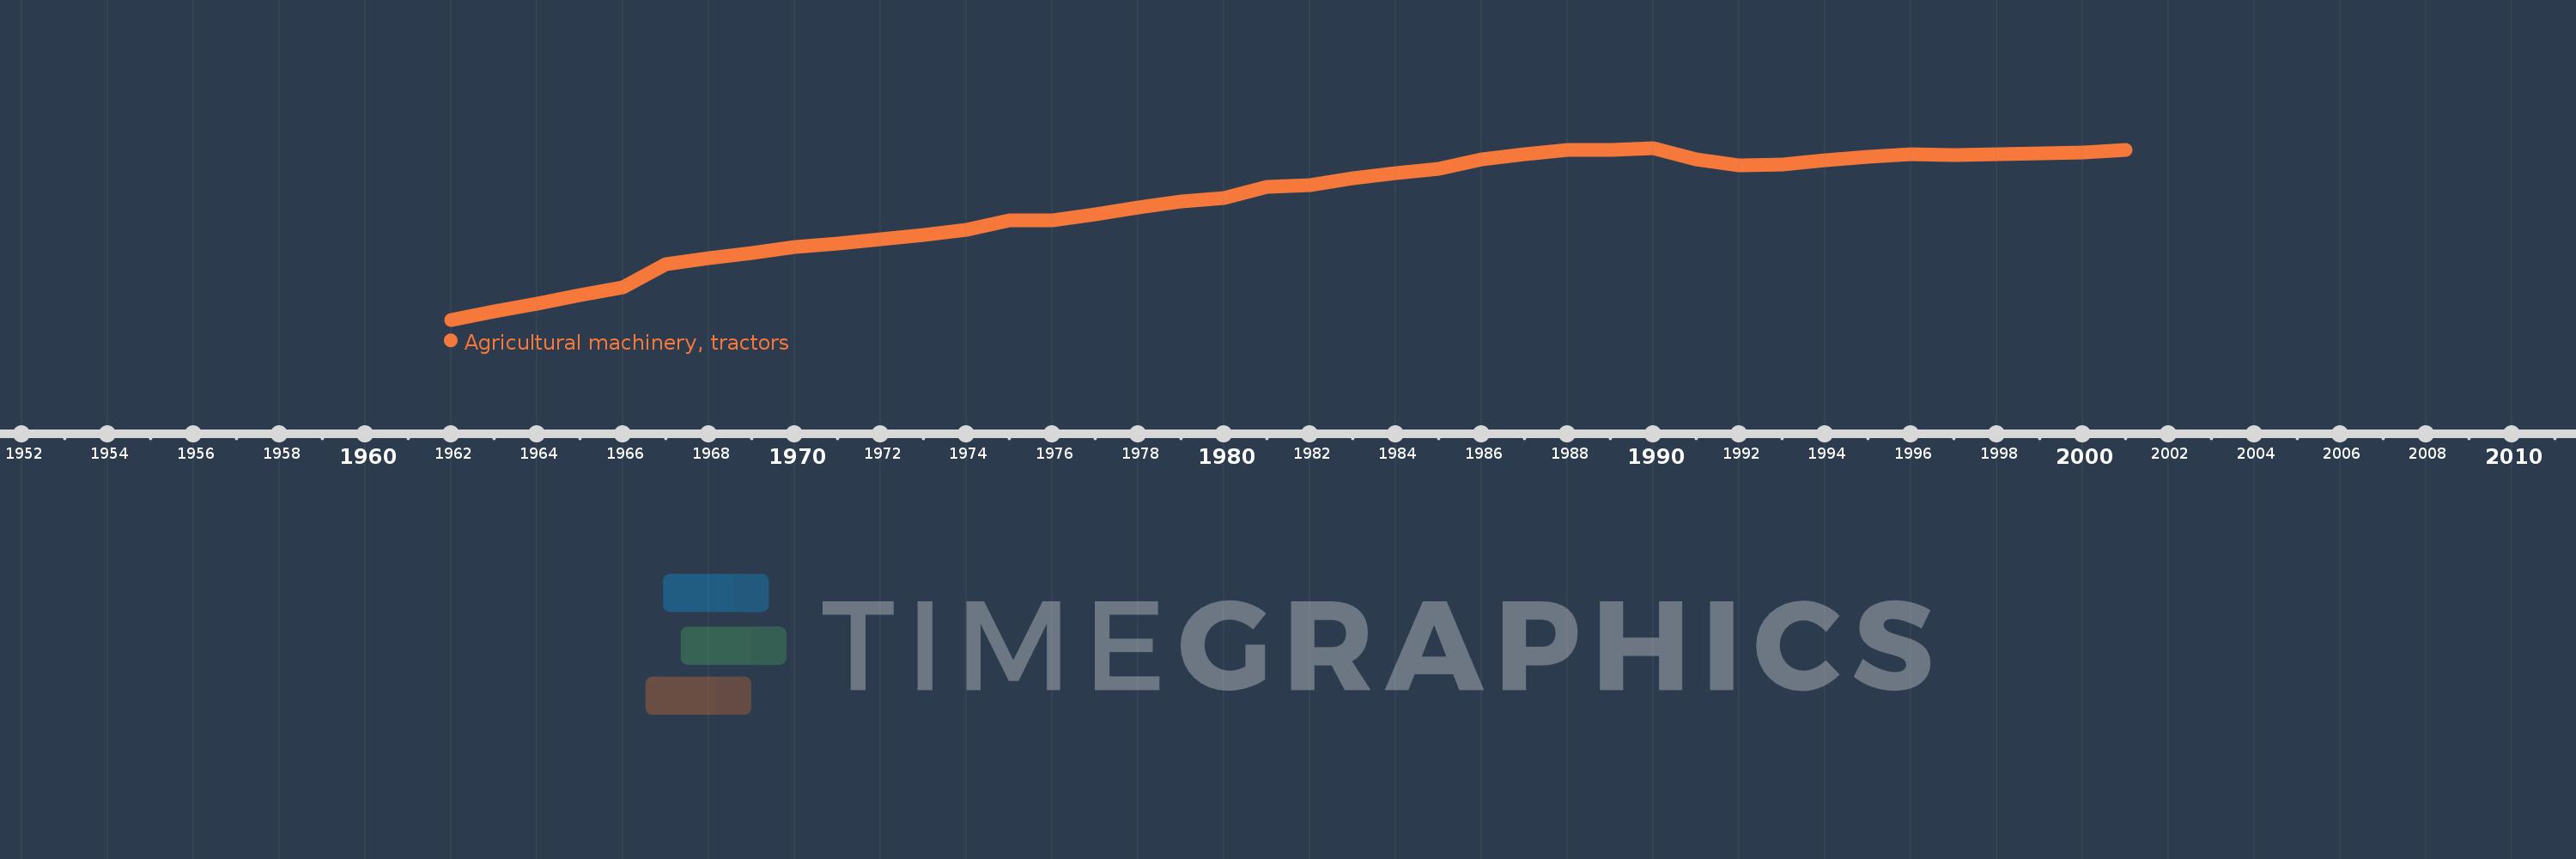
Agricultural machinery, tractors
2001,2000,1999,1998,1997,1996,1995,1994,1993,1992,1991,1990,1989,1988,1987,1986,1985,1984,1983,1982,1981,1980,1979,1978,1977,1976,1975,1974,1973,1972,1971,1970,1969,1968,1967,1966,1965,1964,1963,1962
This statistics in other country:
AfghanistanAlbaniaAlgeriaAmerican SamoaAndorraAngolaAntigua and BarbudaArab WorldArgentinaArmeniaAustraliaAustriaAzerbaijanBahamas, TheBahrainBangladeshBarbadosBelarusBelgiumBelizeBeninBermudaBhutanBoliviaBosnia and HerzegovinaBotswanaBrazilBritish Virgin IslandsBrunei DarussalamBulgariaBurkina FasoBurundiCabo VerdeCambodiaCameroonCanadaCaribbean small statesCentral African RepublicCentral Europe and the BalticsChadChileChinaColombiaCongo, Dem. Rep.Congo, Rep.Costa RicaCote d'IvoireCroatiaCubaCyprusCzech RepublicDenmarkDjiboutiDominicaDominican RepublicEarly-demographic dividendEast Asia & PacificEast Asia & Pacific (excluding high income)East Asia & Pacific (IDA & IBRD countries)EcuadorEgypt, Arab Rep.El SalvadorEritreaEstoniaEuro areaEurope & Central AsiaEurope & Central Asia (excluding high income)Europe & Central Asia (IDA & IBRD countries)European UnionFijiFinlandFragile and conflict affected situationsFranceFrench PolynesiaGambia, TheGeorgiaGermanyGhanaGreeceGreenlandGrenadaGuamGuatemalaGuineaGuinea-BissauGuyanaHaitiHeavily indebted poor countries (HIPC)High incomeHondurasHungaryIBRD onlyIcelandIDA & IBRD totalIDA blendIDA onlyIDA totalIndiaIndonesiaIran, Islamic Rep.IraqIrelandIsraelItalyJamaicaJapanJordanKazakhstanKenyaKiribatiKorea, Dem. People’s Rep.Korea, Rep.KuwaitKyrgyz RepublicLao PDRLate-demographic dividendLatin America & Caribbean Latin America & Caribbean (excluding high income)Latin America & the Caribbean (IDA & IBRD countries)LatviaLeast developed countries: UN classificationLebanonLesothoLibyaLiechtensteinLithuaniaLow & middle incomeLow incomeLower middle incomeLuxembourgMacedonia, FYRMadagascarMalawiMalaysiaMaliMaltaMauritaniaMauritiusMexicoMiddle East & North AfricaMiddle East & North Africa (excluding high income)Middle East & North Africa (IDA & IBRD countries)Middle incomeMoldovaMongoliaMoroccoMozambiqueMyanmarNepalNetherlandsNew CaledoniaNew ZealandNicaraguaNigerNigeriaNorth AmericaNorthern Mariana IslandsNorwayOECD membersOmanOther small statesPacific island small statesPakistanPanamaPapua New GuineaParaguayPeruPhilippinesPolandPortugalPost-demographic dividendPre-demographic dividendPuerto RicoQatarRomaniaRussian FederationRwandaSamoaSao Tome and PrincipeSaudi ArabiaSenegalSerbiaSeychellesSierra LeoneSlovak RepublicSloveniaSmall statesSolomon IslandsSomaliaSouth AfricaSouth AsiaSouth Asia (IDA & IBRD)SpainSri LankaSt. Kitts and NevisSt. LuciaSt. Vincent and the GrenadinesSub-Saharan Africa Sub-Saharan Africa (excluding high income)Sub-Saharan Africa (IDA & IBRD countries)SudanSurinameSwazilandSwedenSwitzerlandSyrian Arab RepublicTajikistanTanzaniaThailandTimor-LesteTogoTongaTrinidad and TobagoTunisiaTurkeyTurkmenistanTuvaluUgandaUkraineUnited Arab EmiratesUnited KingdomUnited StatesUpper middle incomeUruguayVanuatuVenezuela, RBVietnamVirgin Islands (U.S.)West Bank and GazaWorldYemen, Rep.ZambiaZimbabwe Timeline:
This timeline shows a graph from 1962 to 2001 of High income. No data until 1961. Number of actual observations by date: 40.
Source name:
World Development Indicators
Source organization:
Food and Agriculture Organization, electronic files and web site.
Categories, topics:
Agriculture & Rural Development
Last updated:
apr 23, 2017
Indicators value changes by year
Minimum:
9.109 mln
jan 1, 1962
Maximum:
16.231 mln
jan 1, 1990
At the date of observation
Value
Absolute change
Change from previous value
jan 1, 1962
9.109 mln
+9.109 mln
0.0%
jan 1, 1963
9.44 mln
+330.843K
3.63%
jan 1, 1964
9.789 mln
+349.836K
3.71%
jan 1, 1965
10.137 mln
+347.206K
3.55%
jan 1, 1966
10.446 mln
+309.79K
3.06%
jan 1, 1967
11.404 mln
+957.595K
9.17%
jan 1, 1968
11.649 mln
+245.067K
2.15%
jan 1, 1969
11.892 mln
+243.221K
2.09%
jan 1, 1970
12.14 mln
+247.418K
2.08%
jan 1, 1971
12.259 mln
+119.5K
0.98%
jan 1, 1972
12.458 mln
+198.925K
1.62%
jan 1, 1973
12.63 mln
+172.29K
1.38%
jan 1, 1974
12.852 mln
+221.63K
1.75%
jan 1, 1975
13.219 mln
+366.624K
2.85%
jan 1, 1976
13.227 mln
+8.53K
0.06%
jan 1, 1977
13.467 mln
+239.395K
1.81%
jan 1, 1978
13.756 mln
+289.037K
2.15%
jan 1, 1979
14.027 mln
+271.404K
1.97%
jan 1, 1980
14.159 mln
+132.134K
0.94%
jan 1, 1981
14.628 mln
+468.725K
3.31%
jan 1, 1982
14.706 mln
+78.156K
0.53%
jan 1, 1983
14.967 mln
+260.955K
1.77%
jan 1, 1984
15.179 mln
+211.679K
1.41%
jan 1, 1985
15.366 mln
+186.886K
1.23%
jan 1, 1986
15.761 mln
+395.865K
2.58%
jan 1, 1987
15.968 mln
+206.745K
1.31%
jan 1, 1988
16.148 mln
+179.694K
1.13%
jan 1, 1989
16.139 mln
-8.506K
-0.05%
jan 1, 1990
16.231 mln
+91.539K
0.57%
jan 1, 1991
15.758 mln
-472.831K
-2.91%
jan 1, 1992
15.498 mln
-260.237K
-1.65%
jan 1, 1993
15.531 mln
+33.594K
0.22%
jan 1, 1994
15.704 mln
+172.545K
1.11%
jan 1, 1995
15.873 mln
+168.692K
1.07%
jan 1, 1996
15.96 mln
+87.51K
0.55%
jan 1, 1997
15.951 mln
-9.497K
-0.06%
jan 1, 1998
15.957 mln
+6.285K
0.04%
jan 1, 1999
16.008 mln
+51.084K
0.32%
jan 1, 2000
16.045 mln
+36.899K
0.23%
jan 1, 2001
16.135 mln
+90.218K
0.56%
Ranking of countries by current statistics by years


Comments: