29
/
en
AIzaSyAYiBZKx7MnpbEhh9jyipgxe19OcubqV5w
April 1, 2024
36348
IBRD only
IBD
false
2
1
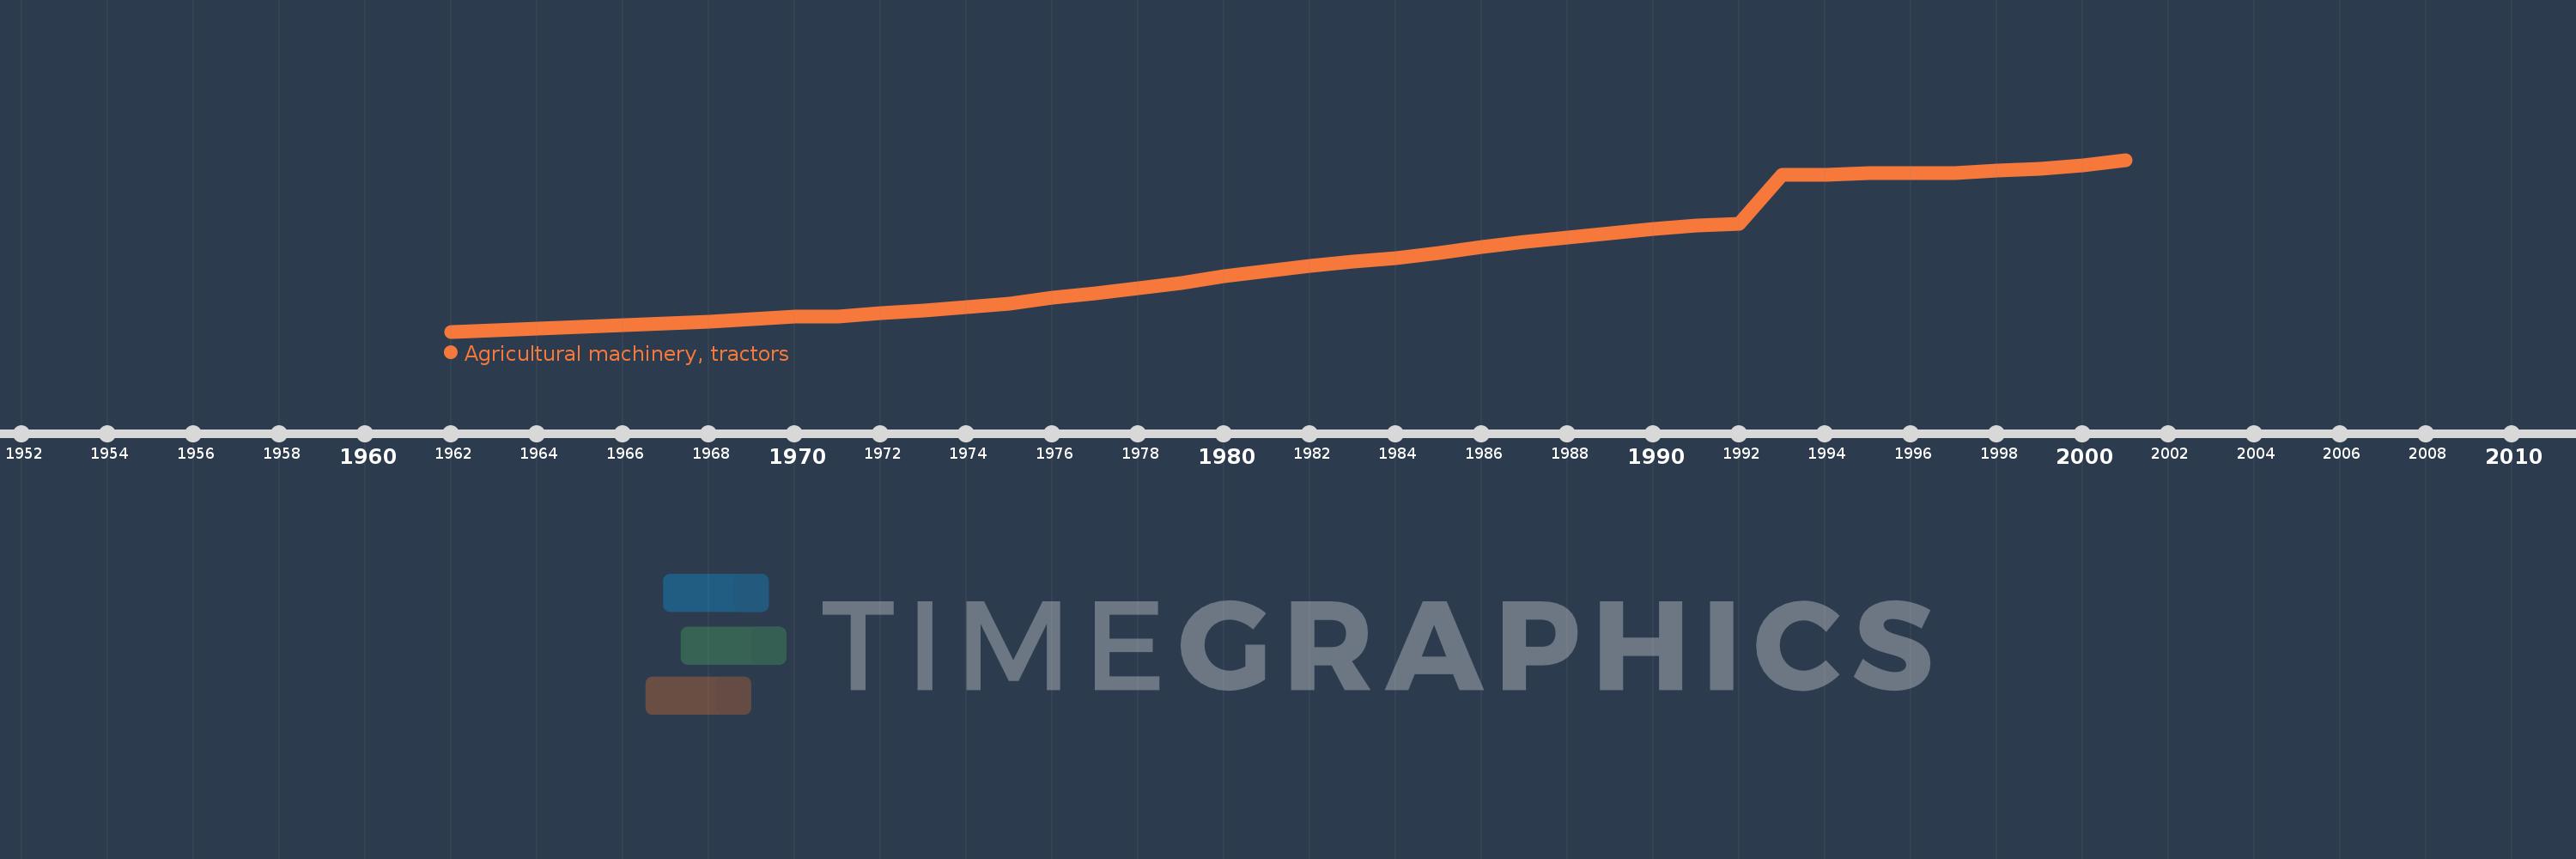
Agricultural machinery, tractors
2001,2000,1999,1998,1997,1996,1995,1994,1993,1992,1991,1990,1989,1988,1987,1986,1985,1984,1983,1982,1981,1980,1979,1978,1977,1976,1975,1974,1973,1972,1971,1970,1969,1968,1967,1966,1965,1964,1963,1962
This statistics in other country:
AfghanistanAlbaniaAlgeriaAmerican SamoaAndorraAngolaAntigua and BarbudaArab WorldArgentinaArmeniaAustraliaAustriaAzerbaijanBahamas, TheBahrainBangladeshBarbadosBelarusBelgiumBelizeBeninBermudaBhutanBoliviaBosnia and HerzegovinaBotswanaBrazilBritish Virgin IslandsBrunei DarussalamBulgariaBurkina FasoBurundiCabo VerdeCambodiaCameroonCanadaCaribbean small statesCentral African RepublicCentral Europe and the BalticsChadChileChinaColombiaCongo, Dem. Rep.Congo, Rep.Costa RicaCote d'IvoireCroatiaCubaCyprusCzech RepublicDenmarkDjiboutiDominicaDominican RepublicEarly-demographic dividendEast Asia & PacificEast Asia & Pacific (excluding high income)East Asia & Pacific (IDA & IBRD countries)EcuadorEgypt, Arab Rep.El SalvadorEritreaEstoniaEuro areaEurope & Central AsiaEurope & Central Asia (excluding high income)Europe & Central Asia (IDA & IBRD countries)European UnionFijiFinlandFragile and conflict affected situationsFranceFrench PolynesiaGambia, TheGeorgiaGermanyGhanaGreeceGreenlandGrenadaGuamGuatemalaGuineaGuinea-BissauGuyanaHaitiHeavily indebted poor countries (HIPC)High incomeHondurasHungaryIBRD onlyIcelandIDA & IBRD totalIDA blendIDA onlyIDA totalIndiaIndonesiaIran, Islamic Rep.IraqIrelandIsraelItalyJamaicaJapanJordanKazakhstanKenyaKiribatiKorea, Dem. People’s Rep.Korea, Rep.KuwaitKyrgyz RepublicLao PDRLate-demographic dividendLatin America & Caribbean Latin America & Caribbean (excluding high income)Latin America & the Caribbean (IDA & IBRD countries)LatviaLeast developed countries: UN classificationLebanonLesothoLibyaLiechtensteinLithuaniaLow & middle incomeLow incomeLower middle incomeLuxembourgMacedonia, FYRMadagascarMalawiMalaysiaMaliMaltaMauritaniaMauritiusMexicoMiddle East & North AfricaMiddle East & North Africa (excluding high income)Middle East & North Africa (IDA & IBRD countries)Middle incomeMoldovaMongoliaMoroccoMozambiqueMyanmarNepalNetherlandsNew CaledoniaNew ZealandNicaraguaNigerNigeriaNorth AmericaNorthern Mariana IslandsNorwayOECD membersOmanOther small statesPacific island small statesPakistanPanamaPapua New GuineaParaguayPeruPhilippinesPolandPortugalPost-demographic dividendPre-demographic dividendPuerto RicoQatarRomaniaRussian FederationRwandaSamoaSao Tome and PrincipeSaudi ArabiaSenegalSerbiaSeychellesSierra LeoneSlovak RepublicSloveniaSmall statesSolomon IslandsSomaliaSouth AfricaSouth AsiaSouth Asia (IDA & IBRD)SpainSri LankaSt. Kitts and NevisSt. LuciaSt. Vincent and the GrenadinesSub-Saharan Africa Sub-Saharan Africa (excluding high income)Sub-Saharan Africa (IDA & IBRD countries)SudanSurinameSwazilandSwedenSwitzerlandSyrian Arab RepublicTajikistanTanzaniaThailandTimor-LesteTogoTongaTrinidad and TobagoTunisiaTurkeyTurkmenistanTuvaluUgandaUkraineUnited Arab EmiratesUnited KingdomUnited StatesUpper middle incomeUruguayVanuatuVenezuela, RBVietnamVirgin Islands (U.S.)West Bank and GazaWorldYemen, Rep.ZambiaZimbabwe Timeline:
This timeline shows a graph from 1962 to 2001 of IBRD only. No data until 1961. Number of actual observations by date: 40.
Source name:
World Development Indicators
Source organization:
Food and Agriculture Organization, electronic files and web site.
Categories, topics:
Agriculture & Rural Development
Last updated:
apr 23, 2017
Indicators value changes by year
Minimum:
852.737K
jan 1, 1962
Maximum:
9.417 mln
jan 1, 2001
At the date of observation
Value
Absolute change
Change from previous value
jan 1, 1962
852.737K
+852.737K
0.0%
jan 1, 1963
919.065K
+66.328K
7.78%
jan 1, 1964
996.662K
+77.597K
8.44%
jan 1, 1965
1.074 mln
+76.845K
7.71%
jan 1, 1966
1.156 mln
+82.628K
7.7%
jan 1, 1967
1.255 mln
+98.59K
8.53%
jan 1, 1968
1.361 mln
+105.907K
8.44%
jan 1, 1969
1.471 mln
+110.683K
8.13%
jan 1, 1970
1.586 mln
+114.323K
7.77%
jan 1, 1971
1.612 mln
+26.683K
1.68%
jan 1, 1972
1.757 mln
+144.25K
8.95%
jan 1, 1973
1.904 mln
+147.885K
8.42%
jan 1, 1974
2.077 mln
+172.809K
9.07%
jan 1, 1975
2.266 mln
+188.601K
9.08%
jan 1, 1976
2.553 mln
+286.763K
12.66%
jan 1, 1977
2.76 mln
+207.521K
8.13%
jan 1, 1978
3.001 mln
+240.702K
8.72%
jan 1, 1979
3.273 mln
+272.28K
9.07%
jan 1, 1980
3.609 mln
+335.93K
10.26%
jan 1, 1981
3.851 mln
+241.471K
6.69%
jan 1, 1982
4.145 mln
+294.272K
7.64%
jan 1, 1983
4.334 mln
+188.924K
4.56%
jan 1, 1984
4.532 mln
+198.366K
4.58%
jan 1, 1985
4.765 mln
+233.148K
5.14%
jan 1, 1986
5.072 mln
+306.808K
6.44%
jan 1, 1987
5.327 mln
+254.554K
5.02%
jan 1, 1988
5.553 mln
+226.235K
4.25%
jan 1, 1989
5.735 mln
+181.882K
3.28%
jan 1, 1990
5.984 mln
+249.642K
4.35%
jan 1, 1991
6.121 mln
+136.505K
2.28%
jan 1, 1992
6.226 mln
+104.826K
1.71%
jan 1, 1993
8.674 mln
+2.448 mln
39.32%
jan 1, 1994
8.681 mln
+7.701K
0.09%
jan 1, 1995
8.763 mln
+82.032K
0.94%
jan 1, 1996
8.774 mln
+10.984K
0.13%
jan 1, 1997
8.749 mln
-25.591K
-0.29%
jan 1, 1998
8.886 mln
+137.559K
1.57%
jan 1, 1999
8.953 mln
+66.987K
0.75%
jan 1, 2000
9.122 mln
+168.68K
1.88%
jan 1, 2001
9.417 mln
+295.542K
3.24%
Ranking of countries by current statistics by years


Comments: