29
/
en
AIzaSyAYiBZKx7MnpbEhh9jyipgxe19OcubqV5w
April 1, 2024
214995
Oman
OMN
true
2
1
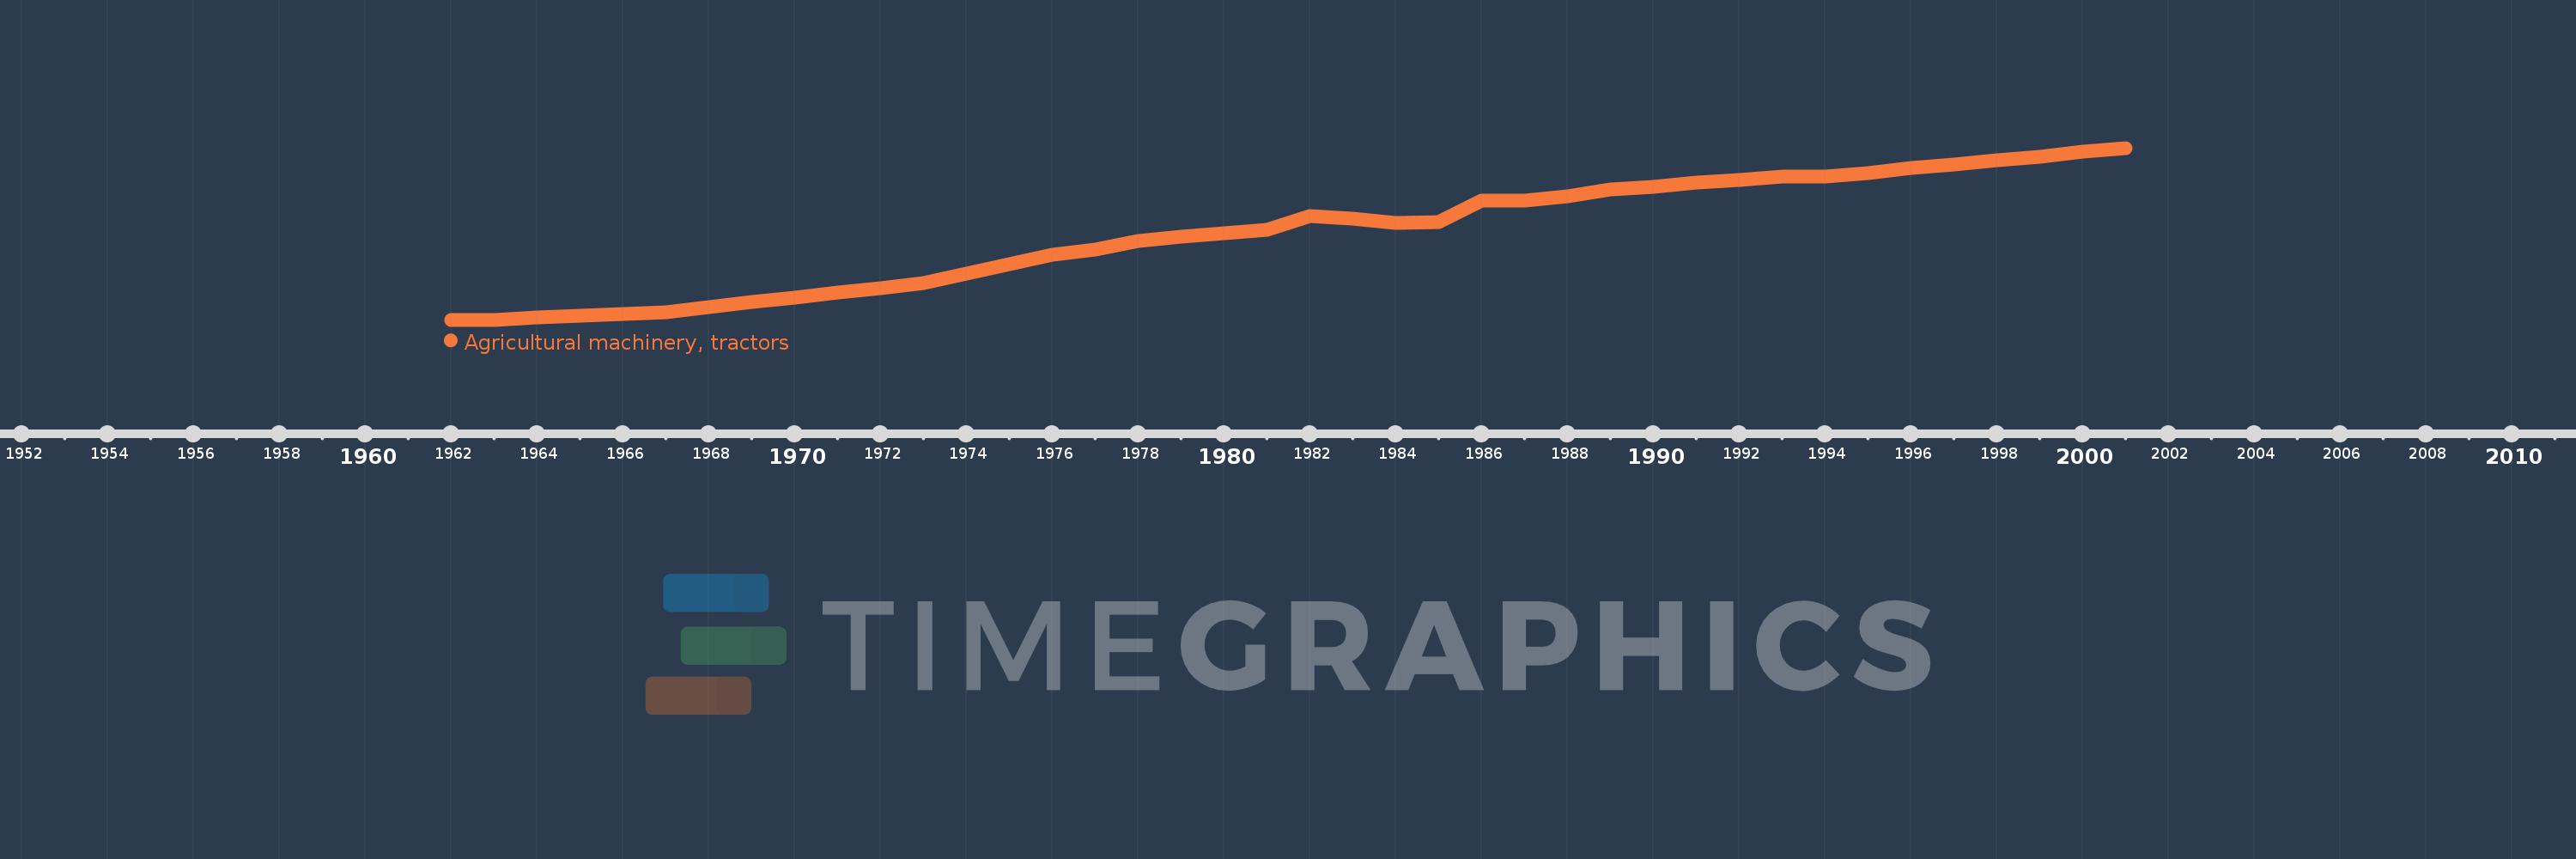
Agricultural machinery, tractors
2001,2000,1999,1998,1997,1996,1995,1994,1993,1992,1991,1990,1989,1988,1987,1986,1985,1984,1983,1982,1981,1980,1979,1978,1977,1976,1975,1974,1973,1972,1971,1970,1969,1968,1967,1966,1965,1964,1963,1962
This statistics in other country:
AfghanistanAlbaniaAlgeriaAmerican SamoaAndorraAngolaAntigua and BarbudaArab WorldArgentinaArmeniaAustraliaAustriaAzerbaijanBahamas, TheBahrainBangladeshBarbadosBelarusBelgiumBelizeBeninBermudaBhutanBoliviaBosnia and HerzegovinaBotswanaBrazilBritish Virgin IslandsBrunei DarussalamBulgariaBurkina FasoBurundiCabo VerdeCambodiaCameroonCanadaCaribbean small statesCentral African RepublicCentral Europe and the BalticsChadChileChinaColombiaCongo, Dem. Rep.Congo, Rep.Costa RicaCote d'IvoireCroatiaCubaCyprusCzech RepublicDenmarkDjiboutiDominicaDominican RepublicEarly-demographic dividendEast Asia & PacificEast Asia & Pacific (excluding high income)East Asia & Pacific (IDA & IBRD countries)EcuadorEgypt, Arab Rep.El SalvadorEritreaEstoniaEuro areaEurope & Central AsiaEurope & Central Asia (excluding high income)Europe & Central Asia (IDA & IBRD countries)European UnionFijiFinlandFragile and conflict affected situationsFranceFrench PolynesiaGambia, TheGeorgiaGermanyGhanaGreeceGreenlandGrenadaGuamGuatemalaGuineaGuinea-BissauGuyanaHaitiHeavily indebted poor countries (HIPC)High incomeHondurasHungaryIBRD onlyIcelandIDA & IBRD totalIDA blendIDA onlyIDA totalIndiaIndonesiaIran, Islamic Rep.IraqIrelandIsraelItalyJamaicaJapanJordanKazakhstanKenyaKiribatiKorea, Dem. People’s Rep.Korea, Rep.KuwaitKyrgyz RepublicLao PDRLate-demographic dividendLatin America & Caribbean Latin America & Caribbean (excluding high income)Latin America & the Caribbean (IDA & IBRD countries)LatviaLeast developed countries: UN classificationLebanonLesothoLibyaLiechtensteinLithuaniaLow & middle incomeLow incomeLower middle incomeLuxembourgMacedonia, FYRMadagascarMalawiMalaysiaMaliMaltaMauritaniaMauritiusMexicoMiddle East & North AfricaMiddle East & North Africa (excluding high income)Middle East & North Africa (IDA & IBRD countries)Middle incomeMoldovaMongoliaMoroccoMozambiqueMyanmarNepalNetherlandsNew CaledoniaNew ZealandNicaraguaNigerNigeriaNorth AmericaNorthern Mariana IslandsNorwayOECD membersOmanOther small statesPacific island small statesPakistanPanamaPapua New GuineaParaguayPeruPhilippinesPolandPortugalPost-demographic dividendPre-demographic dividendPuerto RicoQatarRomaniaRussian FederationRwandaSamoaSao Tome and PrincipeSaudi ArabiaSenegalSerbiaSeychellesSierra LeoneSlovak RepublicSloveniaSmall statesSolomon IslandsSomaliaSouth AfricaSouth AsiaSouth Asia (IDA & IBRD)SpainSri LankaSt. Kitts and NevisSt. LuciaSt. Vincent and the GrenadinesSub-Saharan Africa Sub-Saharan Africa (excluding high income)Sub-Saharan Africa (IDA & IBRD countries)SudanSurinameSwazilandSwedenSwitzerlandSyrian Arab RepublicTajikistanTanzaniaThailandTimor-LesteTogoTongaTrinidad and TobagoTunisiaTurkeyTurkmenistanTuvaluUgandaUkraineUnited Arab EmiratesUnited KingdomUnited StatesUpper middle incomeUruguayVanuatuVenezuela, RBVietnamVirgin Islands (U.S.)West Bank and GazaWorldYemen, Rep.ZambiaZimbabwe Timeline:
This timeline shows a graph from 1962 to 2001 of Oman. No data until 1961. Number of actual observations by date: 40.
Source name:
World Development Indicators
Source organization:
Food and Agriculture Organization, electronic files and web site.
Categories, topics:
Agriculture & Rural Development
Last updated:
apr 23, 2017
Indicators value changes by year
At the date of observation
Value
Absolute change
Change from previous value
jan 1, 1964
4.0
+2.0
100.0%
jan 1, 1965
6.0
+2.0
50.0%
jan 1, 1966
8.0
+2.0
33.33%
jan 1, 1967
10.0
+2.0
25.0%
jan 1, 1968
15.0
+5.0
50.0%
jan 1, 1969
20.0
+5.0
33.33%
jan 1, 1970
25.0
+5.0
25.0%
jan 1, 1971
30.0
+5.0
20.0%
jan 1, 1972
35.0
+5.0
16.67%
jan 1, 1973
40.0
+5.0
14.29%
jan 1, 1974
50.0
+10.0
25.0%
jan 1, 1975
60.0
+10.0
20.0%
jan 1, 1976
69.0
+9.0
15.0%
jan 1, 1977
75.0
+6.0
8.7%
jan 1, 1978
84.0
+9.0
12.0%
jan 1, 1979
88.0
+4.0
4.76%
jan 1, 1980
92.0
+4.0
4.55%
jan 1, 1981
95.0
+3.0
3.26%
jan 1, 1982
109.0
+14.0
14.74%
jan 1, 1983
107.0
-2.0
-1.83%
jan 1, 1984
102.0
-5.0
-4.67%
jan 1, 1985
103.0
+1.0
0.98%
jan 1, 1986
125.0
+22.0
21.36%
jan 1, 1987
125.0
0.0
0.0%
jan 1, 1988
130.0
+5.0
4.0%
jan 1, 1989
137.0
+7.0
5.38%
jan 1, 1990
140.0
+3.0
2.19%
jan 1, 1991
144.0
+4.0
2.86%
jan 1, 1992
147.0
+3.0
2.08%
jan 1, 1993
150.0
+3.0
2.04%
jan 1, 1994
150.0
0.0
0.0%
jan 1, 1995
154.0
+4.0
2.67%
jan 1, 1996
159.0
+5.0
3.25%
jan 1, 1997
163.0
+4.0
2.52%
jan 1, 1998
167.0
+4.0
2.45%
jan 1, 1999
171.0
+4.0
2.4%
jan 1, 2000
176.0
+5.0
2.92%
jan 1, 2001
180.0
+4.0
2.27%
Ranking of countries by current statistics by years


Comments: