29
/
en
AIzaSyAYiBZKx7MnpbEhh9jyipgxe19OcubqV5w
April 1, 2024
54551
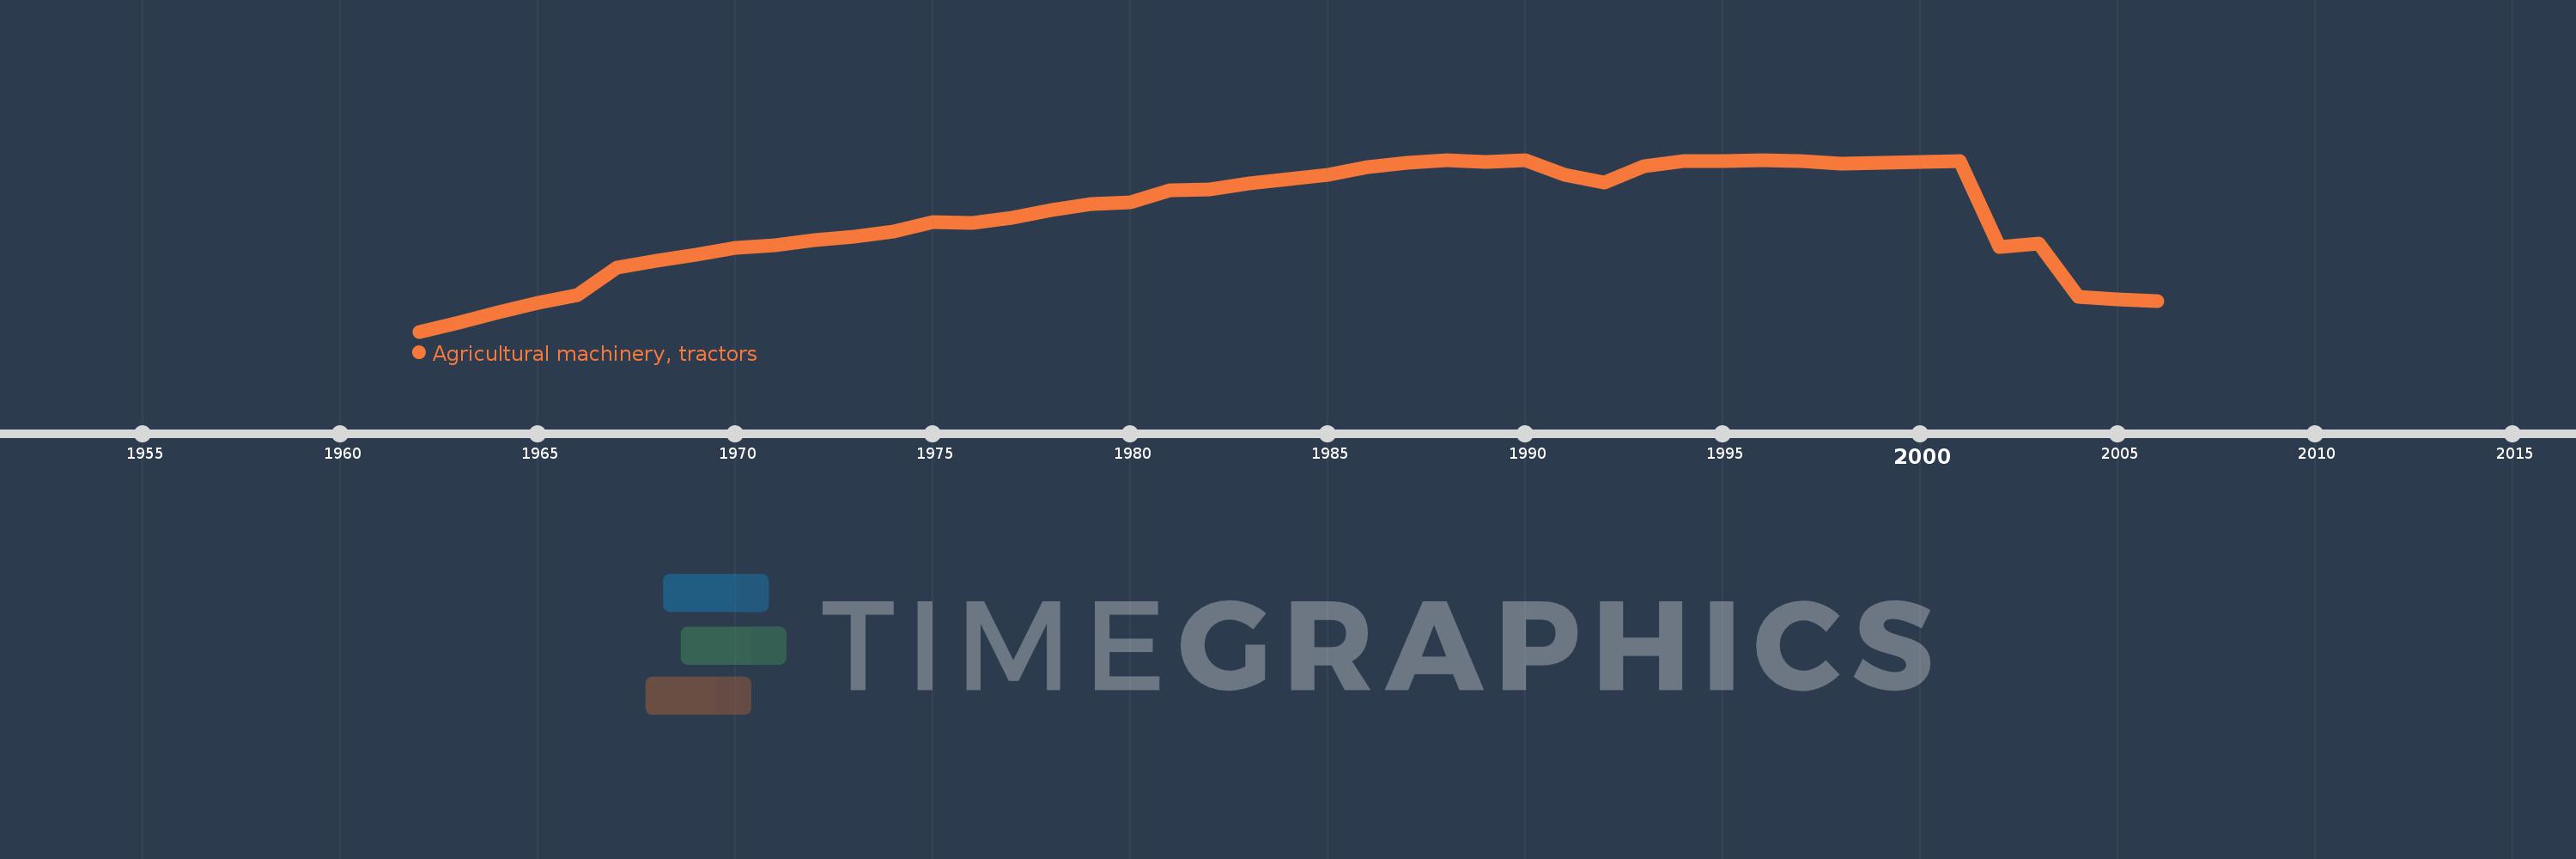
Post-demographic dividend
PST
false
2
1
Agricultural machinery, tractors
2006,2005,2004,2003,2002,2001,2000,1999,1998,1997,1996,1995,1994,1993,1992,1991,1990,1989,1988,1987,1986,1985,1984,1983,1982,1981,1980,1979,1978,1977,1976,1975,1974,1973,1972,1971,1970,1969,1968,1967,1966,1965,1964,1963,1962
This statistics in other country:
AfghanistanAlbaniaAlgeriaAmerican SamoaAndorraAngolaAntigua and BarbudaArab WorldArgentinaArmeniaAustraliaAustriaAzerbaijanBahamas, TheBahrainBangladeshBarbadosBelarusBelgiumBelizeBeninBermudaBhutanBoliviaBosnia and HerzegovinaBotswanaBrazilBritish Virgin IslandsBrunei DarussalamBulgariaBurkina FasoBurundiCabo VerdeCambodiaCameroonCanadaCaribbean small statesCentral African RepublicCentral Europe and the BalticsChadChileChinaColombiaCongo, Dem. Rep.Congo, Rep.Costa RicaCote d'IvoireCroatiaCubaCyprusCzech RepublicDenmarkDjiboutiDominicaDominican RepublicEarly-demographic dividendEast Asia & PacificEast Asia & Pacific (excluding high income)East Asia & Pacific (IDA & IBRD countries)EcuadorEgypt, Arab Rep.El SalvadorEritreaEstoniaEuro areaEurope & Central AsiaEurope & Central Asia (excluding high income)Europe & Central Asia (IDA & IBRD countries)European UnionFijiFinlandFragile and conflict affected situationsFranceFrench PolynesiaGambia, TheGeorgiaGermanyGhanaGreeceGreenlandGrenadaGuamGuatemalaGuineaGuinea-BissauGuyanaHaitiHeavily indebted poor countries (HIPC)High incomeHondurasHungaryIBRD onlyIcelandIDA & IBRD totalIDA blendIDA onlyIDA totalIndiaIndonesiaIran, Islamic Rep.IraqIrelandIsraelItalyJamaicaJapanJordanKazakhstanKenyaKiribatiKorea, Dem. People’s Rep.Korea, Rep.KuwaitKyrgyz RepublicLao PDRLate-demographic dividendLatin America & Caribbean Latin America & Caribbean (excluding high income)Latin America & the Caribbean (IDA & IBRD countries)LatviaLeast developed countries: UN classificationLebanonLesothoLibyaLiechtensteinLithuaniaLow & middle incomeLow incomeLower middle incomeLuxembourgMacedonia, FYRMadagascarMalawiMalaysiaMaliMaltaMauritaniaMauritiusMexicoMiddle East & North AfricaMiddle East & North Africa (excluding high income)Middle East & North Africa (IDA & IBRD countries)Middle incomeMoldovaMongoliaMoroccoMozambiqueMyanmarNepalNetherlandsNew CaledoniaNew ZealandNicaraguaNigerNigeriaNorth AmericaNorthern Mariana IslandsNorwayOECD membersOmanOther small statesPacific island small statesPakistanPanamaPapua New GuineaParaguayPeruPhilippinesPolandPortugalPost-demographic dividendPre-demographic dividendPuerto RicoQatarRomaniaRussian FederationRwandaSamoaSao Tome and PrincipeSaudi ArabiaSenegalSerbiaSeychellesSierra LeoneSlovak RepublicSloveniaSmall statesSolomon IslandsSomaliaSouth AfricaSouth AsiaSouth Asia (IDA & IBRD)SpainSri LankaSt. Kitts and NevisSt. LuciaSt. Vincent and the GrenadinesSub-Saharan Africa Sub-Saharan Africa (excluding high income)Sub-Saharan Africa (IDA & IBRD countries)SudanSurinameSwazilandSwedenSwitzerlandSyrian Arab RepublicTajikistanTanzaniaThailandTimor-LesteTogoTongaTrinidad and TobagoTunisiaTurkeyTurkmenistanTuvaluUgandaUkraineUnited Arab EmiratesUnited KingdomUnited StatesUpper middle incomeUruguayVanuatuVenezuela, RBVietnamVirgin Islands (U.S.)West Bank and GazaWorldYemen, Rep.ZambiaZimbabwe Timeline:
This timeline shows a graph from 1962 to 2006 of Post-demographic dividend. No data until 1961. Number of actual observations by date: 45.
Source name:
World Development Indicators
Source organization:
Food and Agriculture Organization, electronic files and web site.
Categories, topics:
Agriculture & Rural Development
Last updated:
apr 23, 2017
Indicators value changes by year
Minimum:
8.95 mln
jan 1, 1962
Maximum:
14.924 mln
jan 1, 1988
At the date of observation
Value
Absolute change
Change from previous value
jan 1, 1962
8.95 mln
+8.95 mln
0.0%
jan 1, 1963
9.27 mln
+320.611K
3.58%
jan 1, 1964
9.608 mln
+337.694K
3.64%
jan 1, 1965
9.945 mln
+336.629K
3.5%
jan 1, 1966
10.228 mln
+283.415K
2.85%
jan 1, 1967
11.177 mln
+949.073K
9.28%
jan 1, 1968
11.406 mln
+229.45K
2.05%
jan 1, 1969
11.627 mln
+220.047K
1.93%
jan 1, 1970
11.858 mln
+231.898K
1.99%
jan 1, 1971
11.95 mln
+91.977K
0.78%
jan 1, 1972
12.121 mln
+170.822K
1.43%
jan 1, 1973
12.254 mln
+132.29K
1.09%
jan 1, 1974
12.436 mln
+182.111K
1.49%
jan 1, 1975
12.748 mln
+312.203K
2.51%
jan 1, 1976
12.716 mln
-32.007K
-0.25%
jan 1, 1977
12.909 mln
+192.688K
1.52%
jan 1, 1978
13.166 mln
+257.421K
1.99%
jan 1, 1979
13.389 mln
+223.037K
1.69%
jan 1, 1980
13.458 mln
+68.761K
0.51%
jan 1, 1981
13.865 mln
+407.012K
3.02%
jan 1, 1982
13.884 mln
+19.2K
0.14%
jan 1, 1983
14.1 mln
+216.309K
1.56%
jan 1, 1984
14.26 mln
+159.29K
1.13%
jan 1, 1985
14.392 mln
+132.234K
0.93%
jan 1, 1986
14.669 mln
+276.926K
1.92%
jan 1, 1987
14.805 mln
+136.269K
0.93%
jan 1, 1988
14.924 mln
+119.311K
0.81%
jan 1, 1989
14.861 mln
-63.288K
-0.42%
jan 1, 1990
14.902 mln
+40.87K
0.28%
jan 1, 1991
14.394 mln
-507.387K
-3.4%
jan 1, 1992
14.136 mln
-258.916K
-1.8%
jan 1, 1993
14.714 mln
+578.124K
4.09%
jan 1, 1994
14.867 mln
+153.36K
1.04%
jan 1, 1995
14.872 mln
+4.752K
0.03%
jan 1, 1996
14.917 mln
+45.568K
0.31%
jan 1, 1997
14.869 mln
-48.655K
-0.33%
jan 1, 1998
14.793 mln
-75.769K
-0.51%
jan 1, 1999
14.811 mln
+17.772K
0.12%
jan 1, 2000
14.835 mln
+24.298K
0.16%
jan 1, 2001
14.893 mln
+58.481K
0.39%
jan 1, 2002
11.888 mln
-3.005 mln
-20.18%
jan 1, 2003
12.0 mln
+111.718K
0.94%
jan 1, 2004
10.148 mln
-1.852 mln
-15.44%
jan 1, 2005
10.073 mln
-74.664K
-0.74%
jan 1, 2006
10.002 mln
-70.599K
-0.7%
Ranking of countries by current statistics by years


Comments: