29
/
en
AIzaSyAYiBZKx7MnpbEhh9jyipgxe19OcubqV5w
April 1, 2024
34949
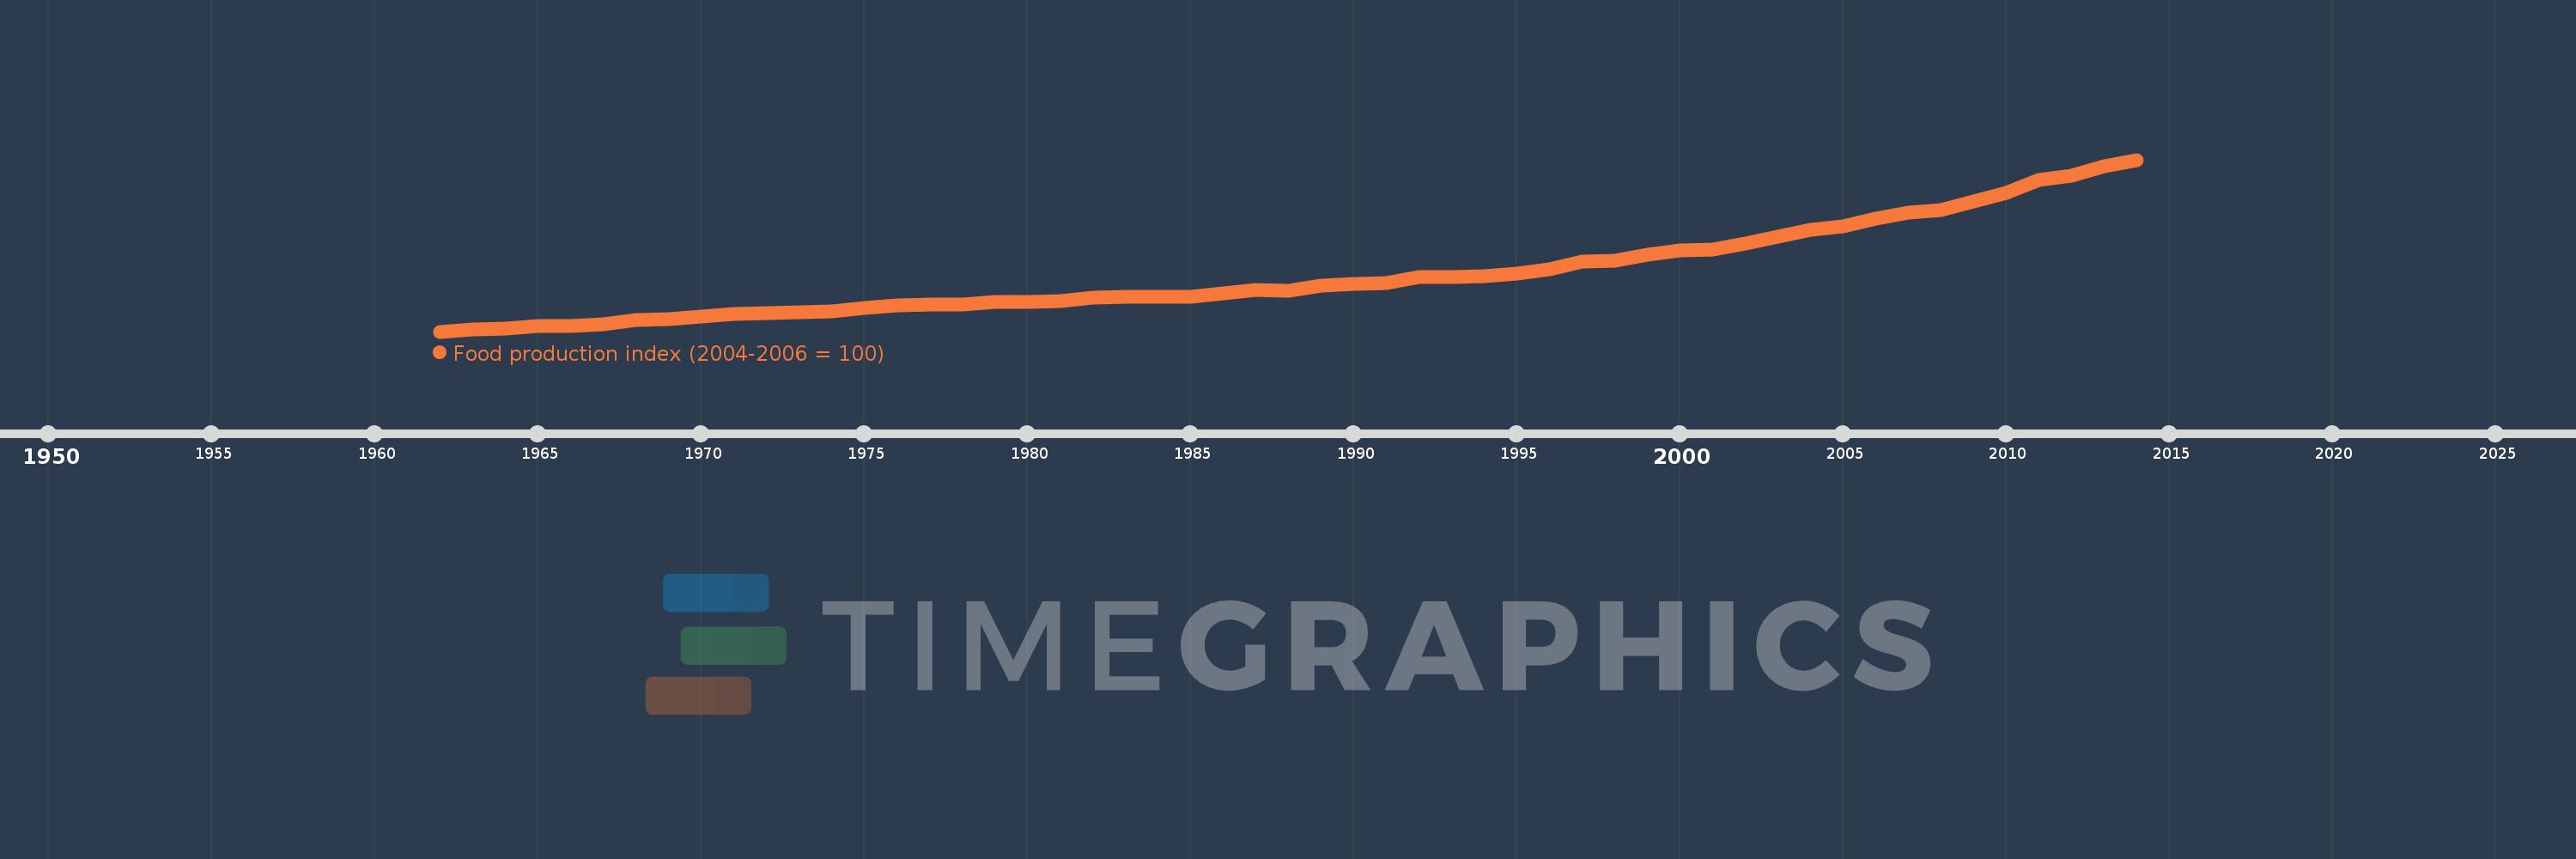
Heavily indebted poor countries (HIPC)
HPC
false
2
1
Food production index (2004-2006 = 100)
2014,2013,2012,2011,2010,2009,2008,2007,2006,2005,2004,2003,2002,2001,2000,1999,1998,1997,1996,1995,1994,1993,1992,1991,1990,1989,1988,1987,1986,1985,1984,1983,1982,1981,1980,1979,1978,1977,1976,1975,1974,1973,1972,1971,1970,1969,1968,1967,1966,1965,1964,1963,1962
This statistics in other country:
AfghanistanAlbaniaAlgeriaAmerican SamoaAngolaAntigua and BarbudaArab WorldArgentinaArmeniaAustraliaAustriaAzerbaijanBahamas, TheBahrainBangladeshBarbadosBelarusBelgiumBelizeBeninBermudaBhutanBoliviaBosnia and HerzegovinaBotswanaBrazilBritish Virgin IslandsBrunei DarussalamBulgariaBurkina FasoBurundiCabo VerdeCambodiaCameroonCanadaCaribbean small statesCayman IslandsCentral African RepublicCentral Europe and the BalticsChadChileChinaColombiaComorosCongo, Dem. Rep.Congo, Rep.Costa RicaCote d'IvoireCroatiaCubaCyprusCzech RepublicDenmarkDjiboutiDominicaDominican RepublicEarly-demographic dividendEast Asia & PacificEast Asia & Pacific (excluding high income)East Asia & Pacific (IDA & IBRD countries)EcuadorEgypt, Arab Rep.El SalvadorEquatorial GuineaEritreaEstoniaEthiopiaEuro areaEurope & Central AsiaEurope & Central Asia (excluding high income)Europe & Central Asia (IDA & IBRD countries)European UnionFaroe IslandsFijiFinlandFragile and conflict affected situationsFranceFrench PolynesiaGabonGambia, TheGeorgiaGermanyGhanaGreeceGreenlandGrenadaGuamGuatemalaGuineaGuinea-BissauGuyanaHaitiHeavily indebted poor countries (HIPC)High incomeHondurasHong Kong SAR, ChinaHungaryIBRD onlyIcelandIDA & IBRD totalIDA blendIDA onlyIDA totalIndiaIndonesiaIran, Islamic Rep.IraqIrelandIsraelItalyJamaicaJapanJordanKazakhstanKenyaKiribatiKorea, Dem. People’s Rep.Korea, Rep.KuwaitKyrgyz RepublicLao PDRLate-demographic dividendLatin America & Caribbean Latin America & Caribbean (excluding high income)Latin America & the Caribbean (IDA & IBRD countries)LatviaLeast developed countries: UN classificationLebanonLesothoLiberiaLibyaLiechtensteinLithuaniaLow & middle incomeLow incomeLower middle incomeLuxembourgMacao SAR, ChinaMacedonia, FYRMadagascarMalawiMalaysiaMaldivesMaliMaltaMarshall IslandsMauritaniaMauritiusMexicoMicronesia, Fed. Sts.Middle East & North AfricaMiddle East & North Africa (excluding high income)Middle East & North Africa (IDA & IBRD countries)Middle incomeMoldovaMongoliaMontenegroMoroccoMozambiqueMyanmarNamibiaNauruNepalNetherlandsNew CaledoniaNew ZealandNicaraguaNigerNigeriaNorth AmericaNorwayOECD membersOmanOther small statesPacific island small statesPakistanPanamaPapua New GuineaParaguayPeruPhilippinesPolandPortugalPost-demographic dividendPre-demographic dividendPuerto RicoQatarRomaniaRussian FederationRwandaSamoaSao Tome and PrincipeSaudi ArabiaSenegalSerbiaSeychellesSierra LeoneSingaporeSlovak RepublicSloveniaSmall statesSolomon IslandsSomaliaSouth AfricaSouth AsiaSouth Asia (IDA & IBRD)SpainSri LankaSt. Kitts and NevisSt. LuciaSt. Vincent and the GrenadinesSub-Saharan Africa Sub-Saharan Africa (excluding high income)Sub-Saharan Africa (IDA & IBRD countries)SudanSurinameSwazilandSwedenSwitzerlandSyrian Arab RepublicTajikistanTanzaniaThailandTimor-LesteTogoTongaTrinidad and TobagoTunisiaTurkeyTurkmenistanTuvaluUgandaUkraineUnited Arab EmiratesUnited KingdomUnited StatesUpper middle incomeUruguayUzbekistanVanuatuVenezuela, RBVietnamVirgin Islands (U.S.)West Bank and GazaWorldYemen, Rep.ZambiaZimbabwe Timeline:
This timeline shows a graph from 1962 to 2014 of Heavily indebted poor countries (HIPC). No data until 1961. Number of actual observations by date: 53.
Source name:
World Development Indicators
Source organization:
Food and Agriculture Organization, electronic files and web site.
Categories, topics:
Agriculture & Rural Development
Last updated:
apr 23, 2017
Indicators value changes by year
Minimum:
33.308
jan 1, 1962
Maximum:
135.354
jan 1, 2014
At the date of observation
Value
Absolute change
Change from previous value
jan 1, 1962
33.308
+33.308
0.0%
jan 1, 1963
34.443
+1.136
3.41%
jan 1, 1964
35.3
+0.857
2.49%
jan 1, 1965
36.47
+1.17
3.31%
jan 1, 1966
36.567
+0.097
0.26%
jan 1, 1967
37.771
+1.204
3.29%
jan 1, 1968
40.252
+2.482
6.57%
jan 1, 1969
40.777
+0.525
1.3%
jan 1, 1970
42.359
+1.582
3.88%
jan 1, 1971
43.638
+1.279
3.02%
jan 1, 1972
44.447
+0.809
1.85%
jan 1, 1973
44.663
+0.216
0.49%
jan 1, 1974
45.117
+0.454
1.02%
jan 1, 1975
47.216
+2.099
4.65%
jan 1, 1976
48.81
+1.594
3.38%
jan 1, 1977
49.517
+0.707
1.45%
jan 1, 1978
49.495
-0.023
-0.05%
jan 1, 1979
51.054
+1.559
3.15%
jan 1, 1980
50.799
-0.255
-0.5%
jan 1, 1981
51.666
+0.868
1.71%
jan 1, 1982
53.713
+2.047
3.96%
jan 1, 1983
53.885
+0.172
0.32%
jan 1, 1984
54.187
+0.302
0.56%
jan 1, 1985
53.878
-0.309
-0.57%
jan 1, 1986
56.263
+2.385
4.43%
jan 1, 1987
57.868
+1.605
2.85%
jan 1, 1988
57.574
-0.295
-0.51%
jan 1, 1989
60.456
+2.882
5.01%
jan 1, 1990
61.522
+1.066
1.76%
jan 1, 1991
62.234
+0.712
1.16%
jan 1, 1992
65.772
+3.538
5.69%
jan 1, 1993
65.527
-0.245
-0.37%
jan 1, 1994
66.155
+0.628
0.96%
jan 1, 1995
67.755
+1.601
2.42%
jan 1, 1996
70.461
+2.706
3.99%
jan 1, 1997
74.764
+4.303
6.11%
jan 1, 1998
75.221
+0.457
0.61%
jan 1, 1999
78.792
+3.57
4.75%
jan 1, 2000
81.37
+2.579
3.27%
jan 1, 2001
81.998
+0.628
0.77%
jan 1, 2002
85.468
+3.469
4.23%
jan 1, 2003
89.71
+4.243
4.96%
jan 1, 2004
93.892
+4.182
4.66%
jan 1, 2005
95.841
+1.948
2.08%
jan 1, 2006
100.388
+4.548
4.74%
jan 1, 2007
103.771
+3.382
3.37%
jan 1, 2008
105.618
+1.847
1.78%
jan 1, 2009
110.828
+5.211
4.93%
jan 1, 2010
115.842
+5.013
4.52%
jan 1, 2011
123.233
+7.392
6.38%
jan 1, 2012
125.787
+2.553
2.07%
jan 1, 2013
131.482
+5.696
4.53%
jan 1, 2014
135.354
+3.872
2.94%
Ranking of countries by current statistics by years


Comments: