29
/
en
AIzaSyAYiBZKx7MnpbEhh9jyipgxe19OcubqV5w
April 1, 2024
27270
East Asia & Pacific
EAS
false
2
1
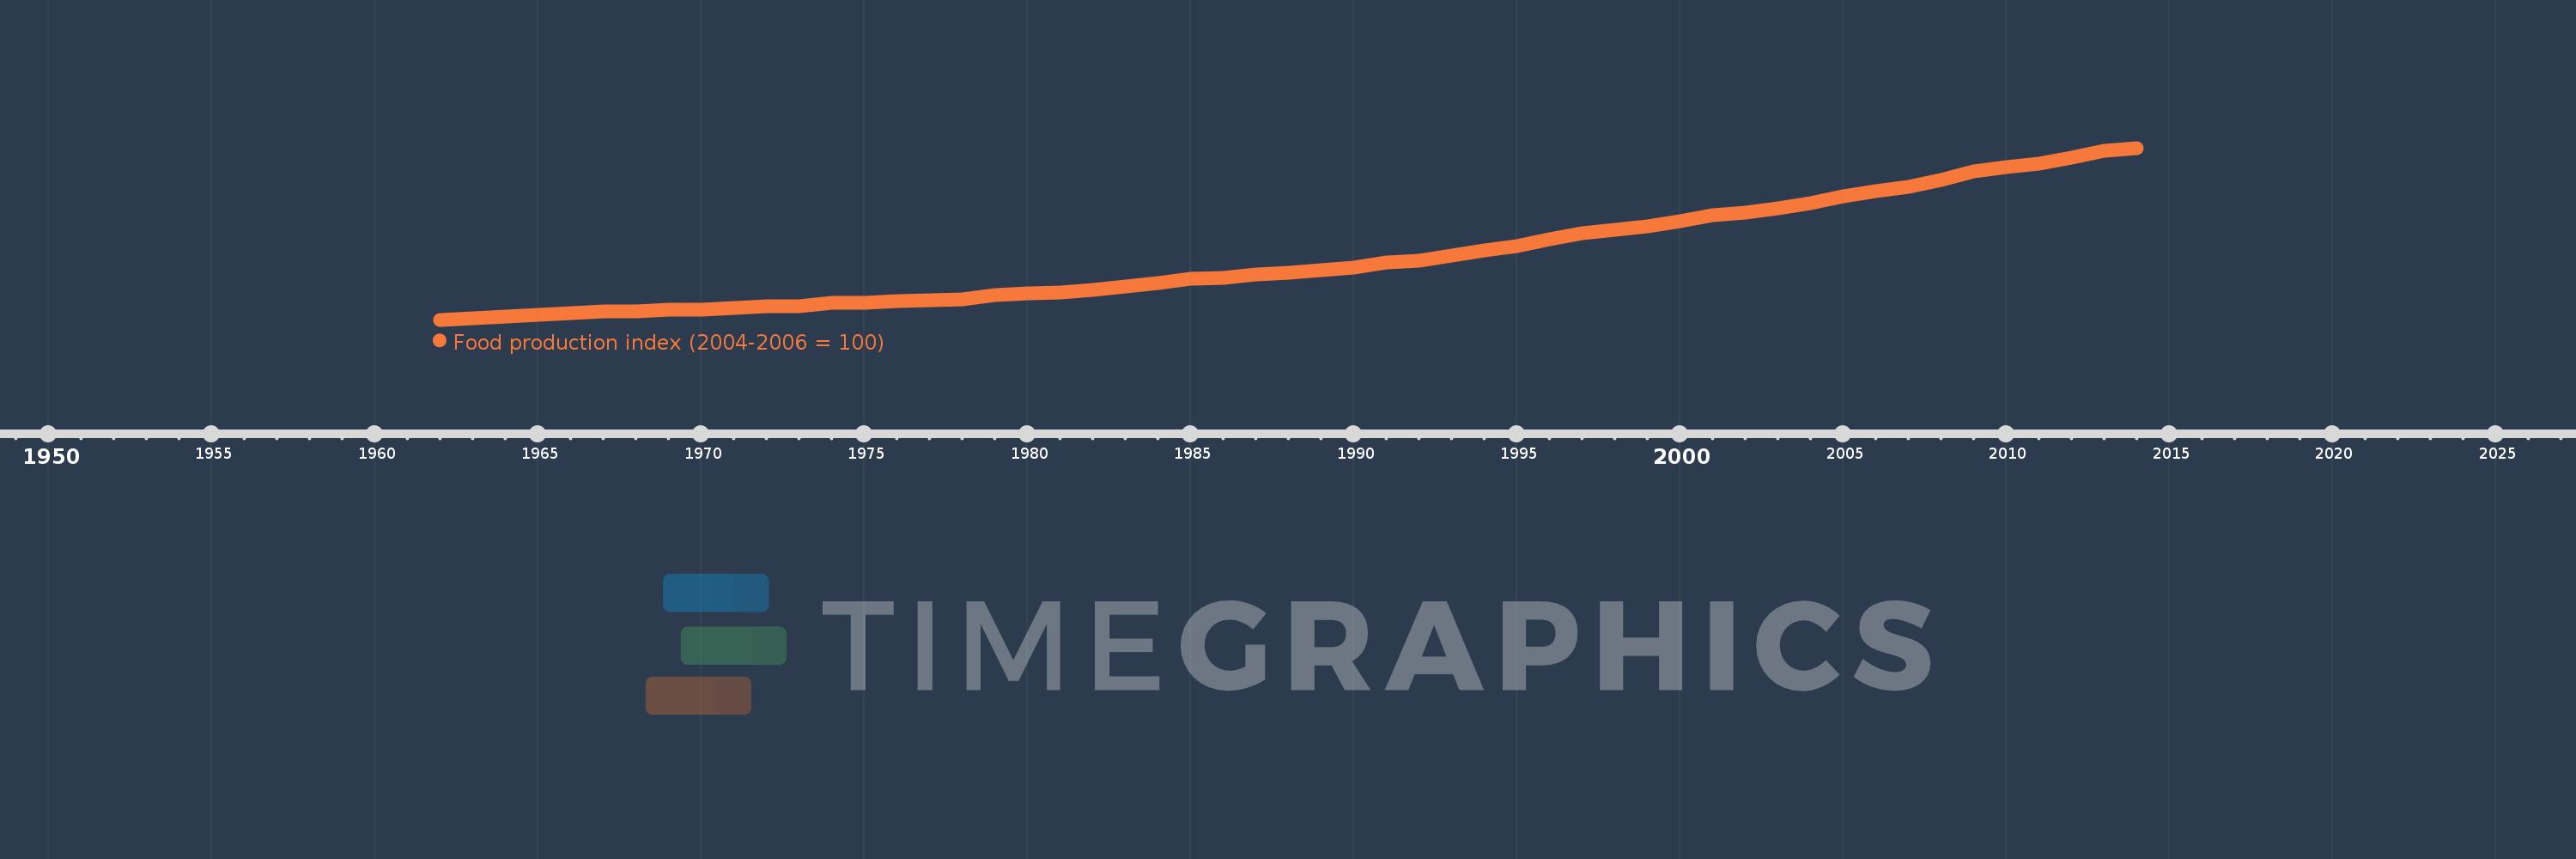
Food production index (2004-2006 = 100)
2014,2013,2012,2011,2010,2009,2008,2007,2006,2005,2004,2003,2002,2001,2000,1999,1998,1997,1996,1995,1994,1993,1992,1991,1990,1989,1988,1987,1986,1985,1984,1983,1982,1981,1980,1979,1978,1977,1976,1975,1974,1973,1972,1971,1970,1969,1968,1967,1966,1965,1964,1963,1962
This statistics in other country:
AfghanistanAlbaniaAlgeriaAmerican SamoaAngolaAntigua and BarbudaArab WorldArgentinaArmeniaAustraliaAustriaAzerbaijanBahamas, TheBahrainBangladeshBarbadosBelarusBelgiumBelizeBeninBermudaBhutanBoliviaBosnia and HerzegovinaBotswanaBrazilBritish Virgin IslandsBrunei DarussalamBulgariaBurkina FasoBurundiCabo VerdeCambodiaCameroonCanadaCaribbean small statesCayman IslandsCentral African RepublicCentral Europe and the BalticsChadChileChinaColombiaComorosCongo, Dem. Rep.Congo, Rep.Costa RicaCote d'IvoireCroatiaCubaCyprusCzech RepublicDenmarkDjiboutiDominicaDominican RepublicEarly-demographic dividendEast Asia & PacificEast Asia & Pacific (excluding high income)East Asia & Pacific (IDA & IBRD countries)EcuadorEgypt, Arab Rep.El SalvadorEquatorial GuineaEritreaEstoniaEthiopiaEuro areaEurope & Central AsiaEurope & Central Asia (excluding high income)Europe & Central Asia (IDA & IBRD countries)European UnionFaroe IslandsFijiFinlandFragile and conflict affected situationsFranceFrench PolynesiaGabonGambia, TheGeorgiaGermanyGhanaGreeceGreenlandGrenadaGuamGuatemalaGuineaGuinea-BissauGuyanaHaitiHeavily indebted poor countries (HIPC)High incomeHondurasHong Kong SAR, ChinaHungaryIBRD onlyIcelandIDA & IBRD totalIDA blendIDA onlyIDA totalIndiaIndonesiaIran, Islamic Rep.IraqIrelandIsraelItalyJamaicaJapanJordanKazakhstanKenyaKiribatiKorea, Dem. People’s Rep.Korea, Rep.KuwaitKyrgyz RepublicLao PDRLate-demographic dividendLatin America & Caribbean Latin America & Caribbean (excluding high income)Latin America & the Caribbean (IDA & IBRD countries)LatviaLeast developed countries: UN classificationLebanonLesothoLiberiaLibyaLiechtensteinLithuaniaLow & middle incomeLow incomeLower middle incomeLuxembourgMacao SAR, ChinaMacedonia, FYRMadagascarMalawiMalaysiaMaldivesMaliMaltaMarshall IslandsMauritaniaMauritiusMexicoMicronesia, Fed. Sts.Middle East & North AfricaMiddle East & North Africa (excluding high income)Middle East & North Africa (IDA & IBRD countries)Middle incomeMoldovaMongoliaMontenegroMoroccoMozambiqueMyanmarNamibiaNauruNepalNetherlandsNew CaledoniaNew ZealandNicaraguaNigerNigeriaNorth AmericaNorwayOECD membersOmanOther small statesPacific island small statesPakistanPanamaPapua New GuineaParaguayPeruPhilippinesPolandPortugalPost-demographic dividendPre-demographic dividendPuerto RicoQatarRomaniaRussian FederationRwandaSamoaSao Tome and PrincipeSaudi ArabiaSenegalSerbiaSeychellesSierra LeoneSingaporeSlovak RepublicSloveniaSmall statesSolomon IslandsSomaliaSouth AfricaSouth AsiaSouth Asia (IDA & IBRD)SpainSri LankaSt. Kitts and NevisSt. LuciaSt. Vincent and the GrenadinesSub-Saharan Africa Sub-Saharan Africa (excluding high income)Sub-Saharan Africa (IDA & IBRD countries)SudanSurinameSwazilandSwedenSwitzerlandSyrian Arab RepublicTajikistanTanzaniaThailandTimor-LesteTogoTongaTrinidad and TobagoTunisiaTurkeyTurkmenistanTuvaluUgandaUkraineUnited Arab EmiratesUnited KingdomUnited StatesUpper middle incomeUruguayUzbekistanVanuatuVenezuela, RBVietnamVirgin Islands (U.S.)West Bank and GazaWorldYemen, Rep.ZambiaZimbabwe Timeline:
This timeline shows a graph from 1962 to 2014 of East Asia & Pacific. No data until 1961. Number of actual observations by date: 53.
Source name:
World Development Indicators
Source organization:
Food and Agriculture Organization, electronic files and web site.
Categories, topics:
Agriculture & Rural Development
Last updated:
apr 23, 2017
Indicators value changes by year
Minimum:
18.895
jan 1, 1962
Maximum:
127.657
jan 1, 2014
At the date of observation
Value
Absolute change
Change from previous value
jan 1, 1962
18.895
+18.895
0.0%
jan 1, 1963
20.035
+1.14
6.03%
jan 1, 1964
20.813
+0.778
3.88%
jan 1, 1965
22.046
+1.233
5.92%
jan 1, 1966
23.002
+0.956
4.34%
jan 1, 1967
24.135
+1.133
4.93%
jan 1, 1968
24.31
+0.175
0.73%
jan 1, 1969
25.057
+0.747
3.07%
jan 1, 1970
25.413
+0.356
1.42%
jan 1, 1971
26.519
+1.105
4.35%
jan 1, 1972
27.485
+0.966
3.64%
jan 1, 1973
27.6
+0.115
0.42%
jan 1, 1974
29.518
+1.919
6.95%
jan 1, 1975
29.645
+0.127
0.43%
jan 1, 1976
30.682
+1.037
3.5%
jan 1, 1977
31.276
+0.594
1.94%
jan 1, 1978
31.934
+0.659
2.11%
jan 1, 1979
34.483
+2.548
7.98%
jan 1, 1980
35.763
+1.28
3.71%
jan 1, 1981
35.988
+0.226
0.63%
jan 1, 1982
37.794
+1.806
5.02%
jan 1, 1983
39.737
+1.943
5.14%
jan 1, 1984
41.97
+2.232
5.62%
jan 1, 1985
44.689
+2.719
6.48%
jan 1, 1986
45.569
+0.88
1.97%
jan 1, 1987
47.301
+1.732
3.8%
jan 1, 1988
48.733
+1.433
3.03%
jan 1, 1989
50.304
+1.571
3.22%
jan 1, 1990
52.109
+1.805
3.59%
jan 1, 1991
55.16
+3.051
5.85%
jan 1, 1992
56.449
+1.289
2.34%
jan 1, 1993
59.527
+3.078
5.45%
jan 1, 1994
62.798
+3.271
5.5%
jan 1, 1995
65.504
+2.706
4.31%
jan 1, 1996
69.805
+4.301
6.57%
jan 1, 1997
73.794
+3.989
5.71%
jan 1, 1998
75.565
+1.77
2.4%
jan 1, 1999
78.23
+2.665
3.53%
jan 1, 2000
81.46
+3.23
4.13%
jan 1, 2001
84.843
+3.383
4.15%
jan 1, 2002
86.758
+1.915
2.26%
jan 1, 2003
89.689
+2.931
3.38%
jan 1, 2004
92.556
+2.867
3.2%
jan 1, 2005
96.907
+4.351
4.7%
jan 1, 2006
100.277
+3.37
3.48%
jan 1, 2007
102.816
+2.539
2.53%
jan 1, 2008
107.507
+4.691
4.56%
jan 1, 2009
112.716
+5.209
4.85%
jan 1, 2010
115.64
+2.924
2.59%
jan 1, 2011
117.794
+2.154
1.86%
jan 1, 2012
121.355
+3.561
3.02%
jan 1, 2013
126.117
+4.763
3.92%
jan 1, 2014
127.657
+1.54
1.22%
Ranking of countries by current statistics by years


Comments: