29
/
en
AIzaSyAYiBZKx7MnpbEhh9jyipgxe19OcubqV5w
April 1, 2024
61595
Upper middle income
UMC
false
2
1
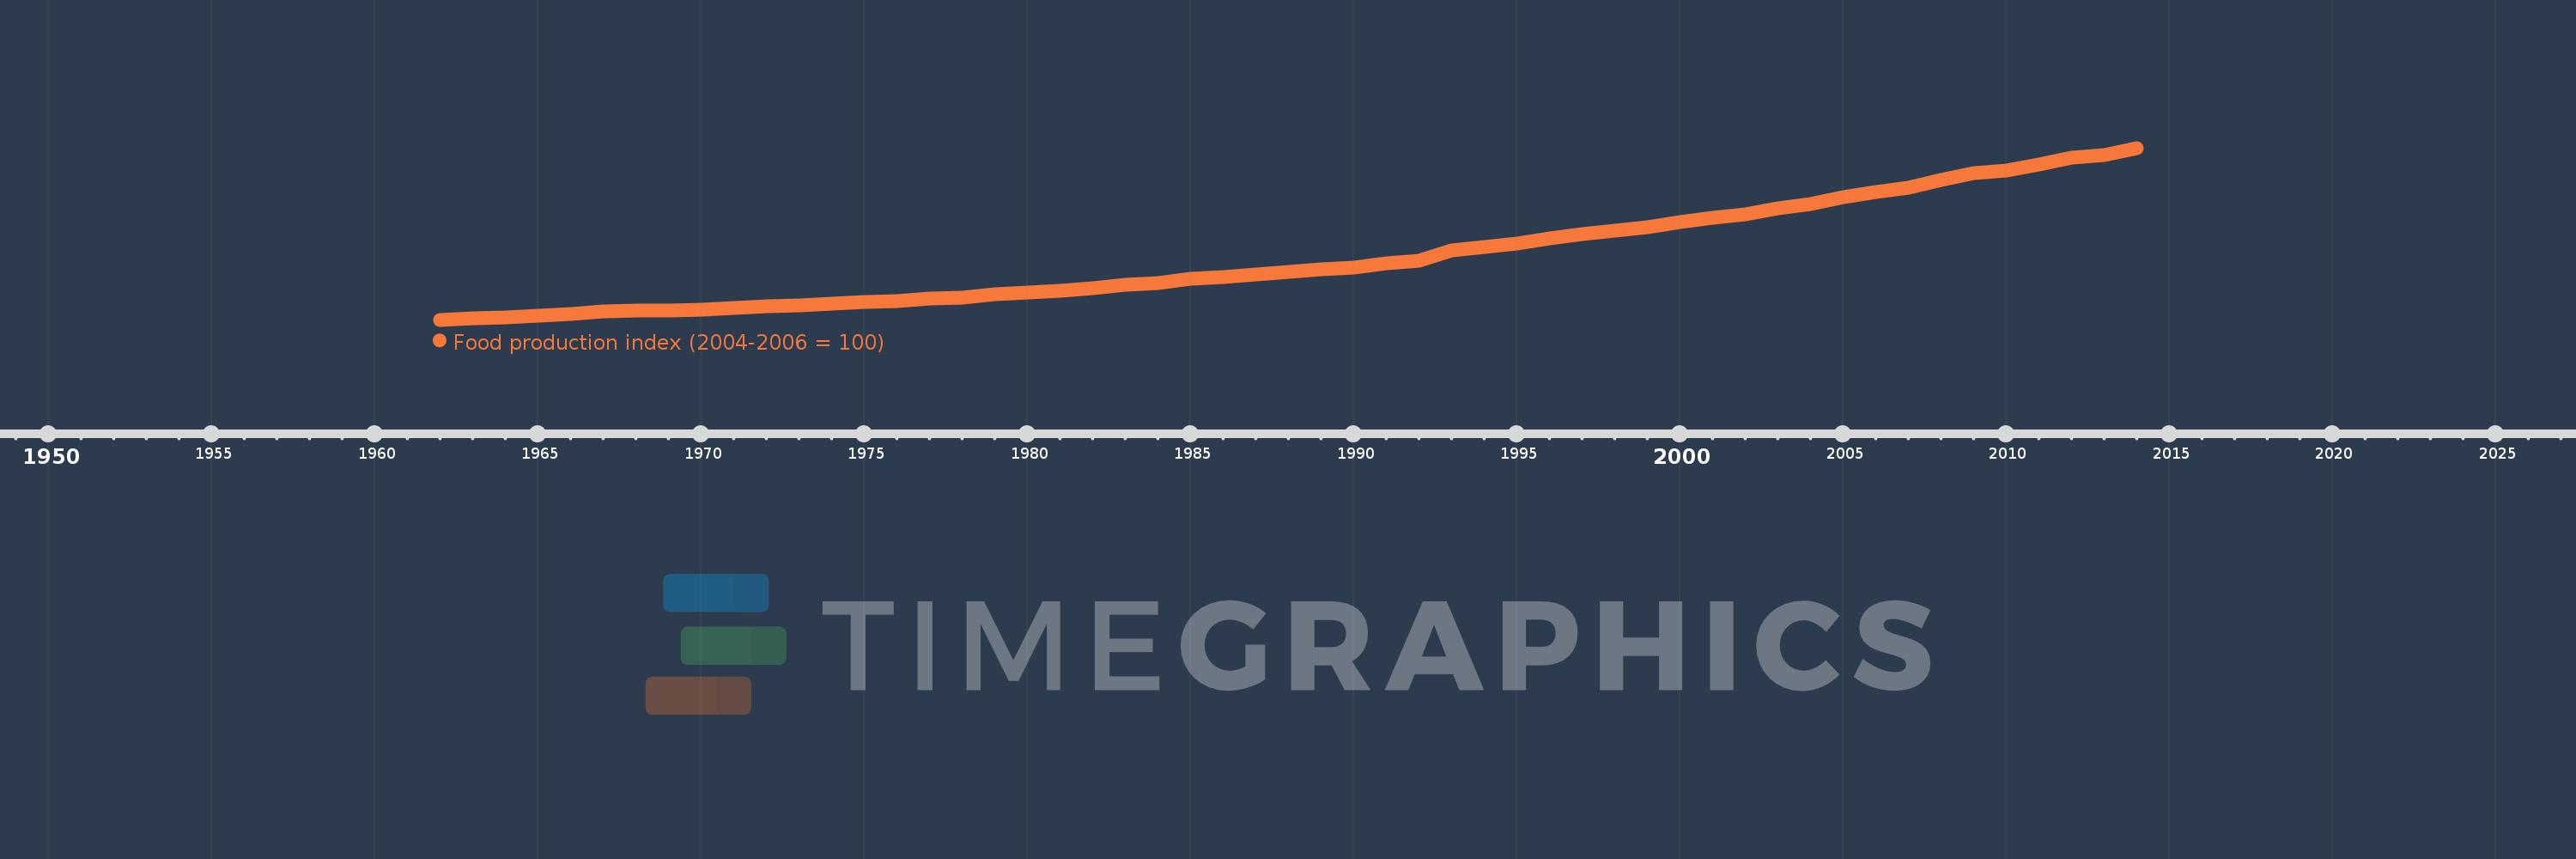
Food production index (2004-2006 = 100)
2014,2013,2012,2011,2010,2009,2008,2007,2006,2005,2004,2003,2002,2001,2000,1999,1998,1997,1996,1995,1994,1993,1992,1991,1990,1989,1988,1987,1986,1985,1984,1983,1982,1981,1980,1979,1978,1977,1976,1975,1974,1973,1972,1971,1970,1969,1968,1967,1966,1965,1964,1963,1962
This statistics in other country:
AfghanistanAlbaniaAlgeriaAmerican SamoaAngolaAntigua and BarbudaArab WorldArgentinaArmeniaAustraliaAustriaAzerbaijanBahamas, TheBahrainBangladeshBarbadosBelarusBelgiumBelizeBeninBermudaBhutanBoliviaBosnia and HerzegovinaBotswanaBrazilBritish Virgin IslandsBrunei DarussalamBulgariaBurkina FasoBurundiCabo VerdeCambodiaCameroonCanadaCaribbean small statesCayman IslandsCentral African RepublicCentral Europe and the BalticsChadChileChinaColombiaComorosCongo, Dem. Rep.Congo, Rep.Costa RicaCote d'IvoireCroatiaCubaCyprusCzech RepublicDenmarkDjiboutiDominicaDominican RepublicEarly-demographic dividendEast Asia & PacificEast Asia & Pacific (excluding high income)East Asia & Pacific (IDA & IBRD countries)EcuadorEgypt, Arab Rep.El SalvadorEquatorial GuineaEritreaEstoniaEthiopiaEuro areaEurope & Central AsiaEurope & Central Asia (excluding high income)Europe & Central Asia (IDA & IBRD countries)European UnionFaroe IslandsFijiFinlandFragile and conflict affected situationsFranceFrench PolynesiaGabonGambia, TheGeorgiaGermanyGhanaGreeceGreenlandGrenadaGuamGuatemalaGuineaGuinea-BissauGuyanaHaitiHeavily indebted poor countries (HIPC)High incomeHondurasHong Kong SAR, ChinaHungaryIBRD onlyIcelandIDA & IBRD totalIDA blendIDA onlyIDA totalIndiaIndonesiaIran, Islamic Rep.IraqIrelandIsraelItalyJamaicaJapanJordanKazakhstanKenyaKiribatiKorea, Dem. People’s Rep.Korea, Rep.KuwaitKyrgyz RepublicLao PDRLate-demographic dividendLatin America & Caribbean Latin America & Caribbean (excluding high income)Latin America & the Caribbean (IDA & IBRD countries)LatviaLeast developed countries: UN classificationLebanonLesothoLiberiaLibyaLiechtensteinLithuaniaLow & middle incomeLow incomeLower middle incomeLuxembourgMacao SAR, ChinaMacedonia, FYRMadagascarMalawiMalaysiaMaldivesMaliMaltaMarshall IslandsMauritaniaMauritiusMexicoMicronesia, Fed. Sts.Middle East & North AfricaMiddle East & North Africa (excluding high income)Middle East & North Africa (IDA & IBRD countries)Middle incomeMoldovaMongoliaMontenegroMoroccoMozambiqueMyanmarNamibiaNauruNepalNetherlandsNew CaledoniaNew ZealandNicaraguaNigerNigeriaNorth AmericaNorwayOECD membersOmanOther small statesPacific island small statesPakistanPanamaPapua New GuineaParaguayPeruPhilippinesPolandPortugalPost-demographic dividendPre-demographic dividendPuerto RicoQatarRomaniaRussian FederationRwandaSamoaSao Tome and PrincipeSaudi ArabiaSenegalSerbiaSeychellesSierra LeoneSingaporeSlovak RepublicSloveniaSmall statesSolomon IslandsSomaliaSouth AfricaSouth AsiaSouth Asia (IDA & IBRD)SpainSri LankaSt. Kitts and NevisSt. LuciaSt. Vincent and the GrenadinesSub-Saharan Africa Sub-Saharan Africa (excluding high income)Sub-Saharan Africa (IDA & IBRD countries)SudanSurinameSwazilandSwedenSwitzerlandSyrian Arab RepublicTajikistanTanzaniaThailandTimor-LesteTogoTongaTrinidad and TobagoTunisiaTurkeyTurkmenistanTuvaluUgandaUkraineUnited Arab EmiratesUnited KingdomUnited StatesUpper middle incomeUruguayUzbekistanVanuatuVenezuela, RBVietnamVirgin Islands (U.S.)West Bank and GazaWorldYemen, Rep.ZambiaZimbabwe Timeline:
This timeline shows a graph from 1962 to 2014 of Upper middle income. No data until 1961. Number of actual observations by date: 53.
Source name:
World Development Indicators
Source organization:
Food and Agriculture Organization, electronic files and web site.
Categories, topics:
Agriculture & Rural Development
Last updated:
apr 23, 2017
Indicators value changes by year
Minimum:
19.482
jan 1, 1962
Maximum:
128.003
jan 1, 2014
At the date of observation
Value
Absolute change
Change from previous value
jan 1, 1962
19.482
+19.482
0.0%
jan 1, 1963
20.281
+0.8
4.11%
jan 1, 1964
21.122
+0.84
4.14%
jan 1, 1965
21.961
+0.839
3.97%
jan 1, 1966
23.353
+1.391
6.33%
jan 1, 1967
24.482
+1.129
4.84%
jan 1, 1968
25.298
+0.816
3.33%
jan 1, 1969
25.44
+0.142
0.56%
jan 1, 1970
26.025
+0.585
2.3%
jan 1, 1971
27.026
+1.001
3.85%
jan 1, 1972
27.946
+0.92
3.41%
jan 1, 1973
28.467
+0.52
1.86%
jan 1, 1974
29.485
+1.019
3.58%
jan 1, 1975
30.457
+0.972
3.3%
jan 1, 1976
31.454
+0.997
3.27%
jan 1, 1977
32.778
+1.324
4.21%
jan 1, 1978
33.299
+0.521
1.59%
jan 1, 1979
35.576
+2.277
6.84%
jan 1, 1980
36.657
+1.081
3.04%
jan 1, 1981
37.528
+0.871
2.38%
jan 1, 1982
39.364
+1.836
4.89%
jan 1, 1983
41.598
+2.233
5.67%
jan 1, 1984
42.423
+0.825
1.98%
jan 1, 1985
45.421
+2.998
7.07%
jan 1, 1986
46.493
+1.073
2.36%
jan 1, 1987
48.064
+1.571
3.38%
jan 1, 1988
49.561
+1.496
3.11%
jan 1, 1989
51.224
+1.663
3.36%
jan 1, 1990
52.444
+1.22
2.38%
jan 1, 1991
55.375
+2.931
5.59%
jan 1, 1992
56.813
+1.438
2.6%
jan 1, 1993
63.284
+6.471
11.39%
jan 1, 1994
65.596
+2.312
3.65%
jan 1, 1995
67.564
+1.969
3.0%
jan 1, 1996
70.805
+3.241
4.8%
jan 1, 1997
73.739
+2.934
4.14%
jan 1, 1998
75.938
+2.2
2.98%
jan 1, 1999
77.884
+1.946
2.56%
jan 1, 2000
81.279
+3.394
4.36%
jan 1, 2001
84.041
+2.763
3.4%
jan 1, 2002
86.174
+2.133
2.54%
jan 1, 2003
89.717
+3.542
4.11%
jan 1, 2004
92.488
+2.771
3.09%
jan 1, 2005
96.751
+4.263
4.61%
jan 1, 2006
100.141
+3.39
3.5%
jan 1, 2007
103.092
+2.951
2.95%
jan 1, 2008
107.848
+4.755
4.61%
jan 1, 2009
112.276
+4.428
4.11%
jan 1, 2010
113.975
+1.699
1.51%
jan 1, 2011
117.364
+3.389
2.97%
jan 1, 2012
121.789
+4.425
3.77%
jan 1, 2013
123.476
+1.687
1.39%
jan 1, 2014
128.003
+4.527
3.67%
Ranking of countries by current statistics by years


Comments: