29
/
en
AIzaSyAYiBZKx7MnpbEhh9jyipgxe19OcubqV5w
April 1, 2024
54056
Pacific island small states
PSS
false
2
1
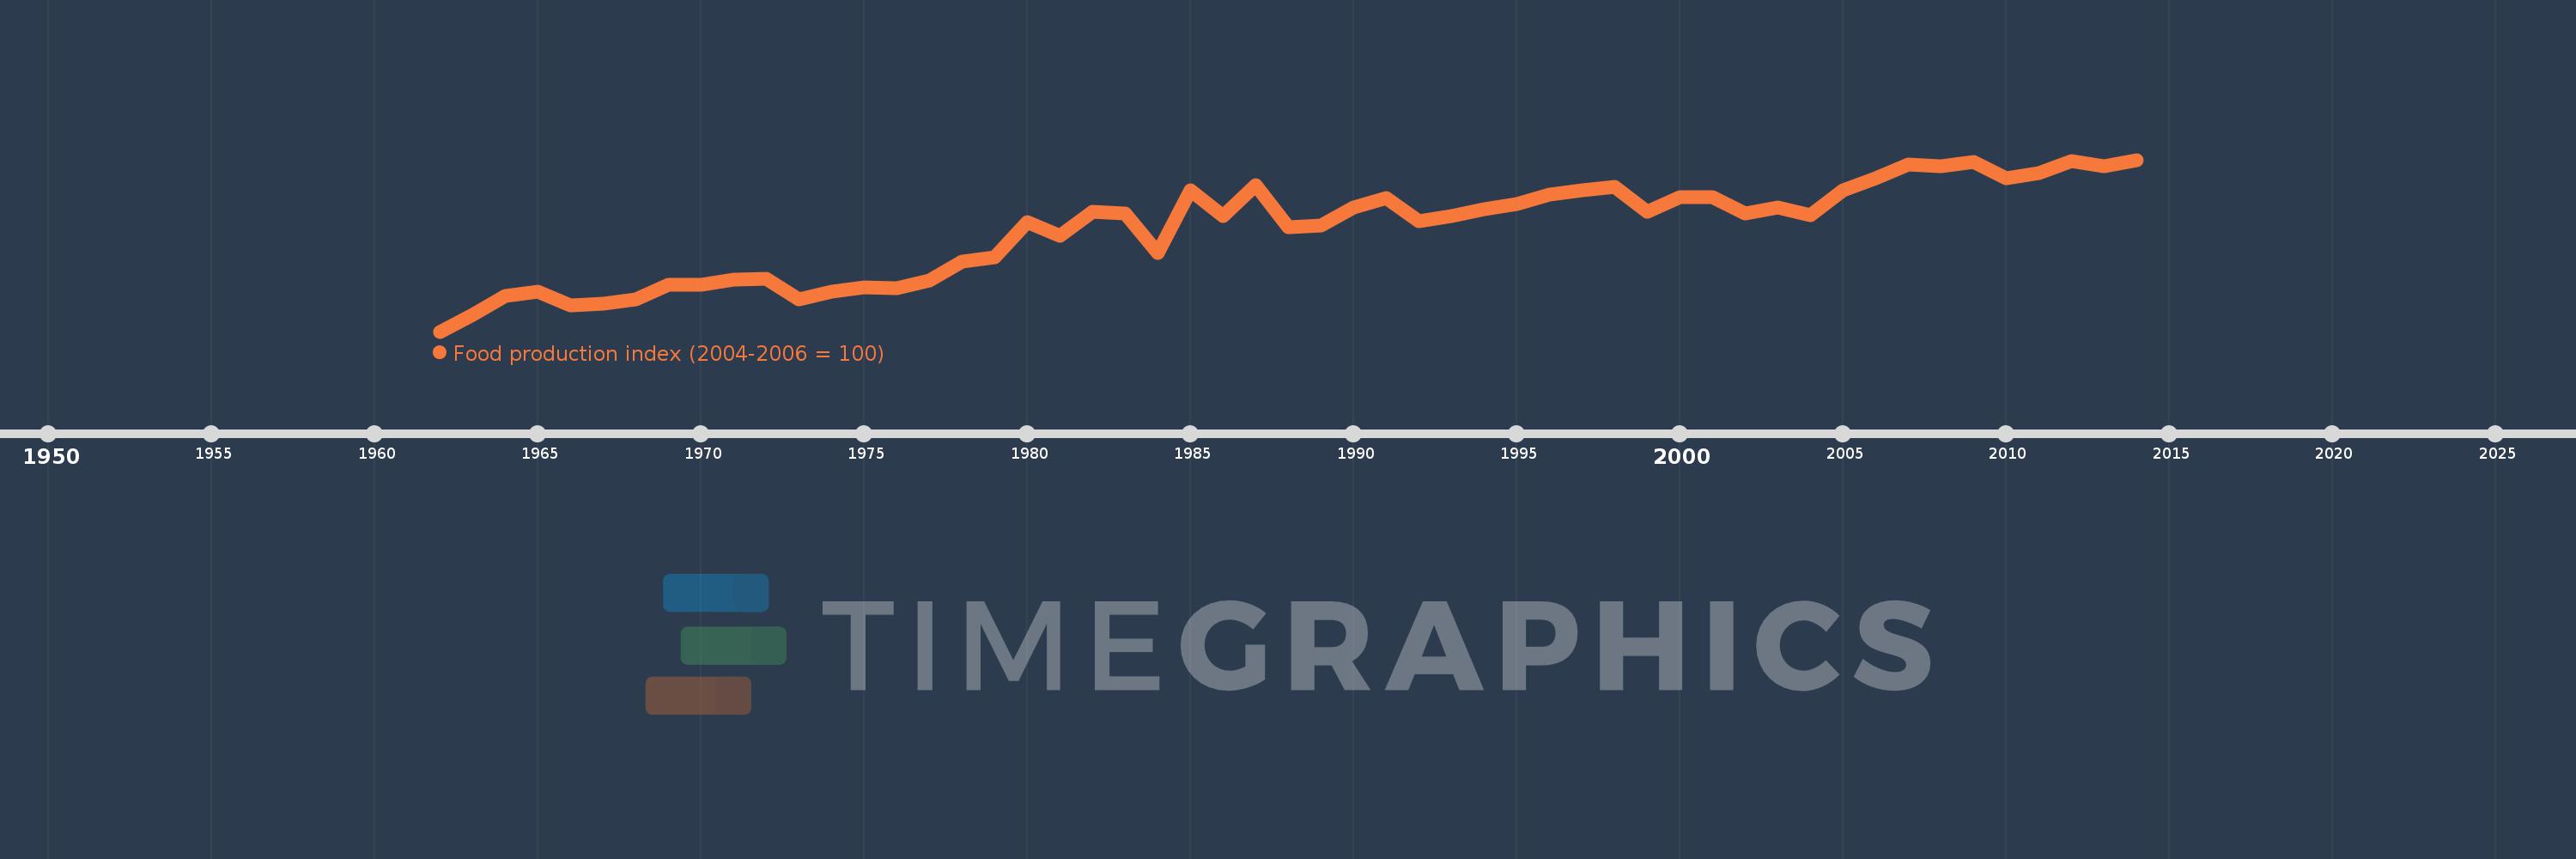
Food production index (2004-2006 = 100)
2014,2013,2012,2011,2010,2009,2008,2007,2006,2005,2004,2003,2002,2001,2000,1999,1998,1997,1996,1995,1994,1993,1992,1991,1990,1989,1988,1987,1986,1985,1984,1983,1982,1981,1980,1979,1978,1977,1976,1975,1974,1973,1972,1971,1970,1969,1968,1967,1966,1965,1964,1963,1962
This statistics in other country:
AfghanistanAlbaniaAlgeriaAmerican SamoaAngolaAntigua and BarbudaArab WorldArgentinaArmeniaAustraliaAustriaAzerbaijanBahamas, TheBahrainBangladeshBarbadosBelarusBelgiumBelizeBeninBermudaBhutanBoliviaBosnia and HerzegovinaBotswanaBrazilBritish Virgin IslandsBrunei DarussalamBulgariaBurkina FasoBurundiCabo VerdeCambodiaCameroonCanadaCaribbean small statesCayman IslandsCentral African RepublicCentral Europe and the BalticsChadChileChinaColombiaComorosCongo, Dem. Rep.Congo, Rep.Costa RicaCote d'IvoireCroatiaCubaCyprusCzech RepublicDenmarkDjiboutiDominicaDominican RepublicEarly-demographic dividendEast Asia & PacificEast Asia & Pacific (excluding high income)East Asia & Pacific (IDA & IBRD countries)EcuadorEgypt, Arab Rep.El SalvadorEquatorial GuineaEritreaEstoniaEthiopiaEuro areaEurope & Central AsiaEurope & Central Asia (excluding high income)Europe & Central Asia (IDA & IBRD countries)European UnionFaroe IslandsFijiFinlandFragile and conflict affected situationsFranceFrench PolynesiaGabonGambia, TheGeorgiaGermanyGhanaGreeceGreenlandGrenadaGuamGuatemalaGuineaGuinea-BissauGuyanaHaitiHeavily indebted poor countries (HIPC)High incomeHondurasHong Kong SAR, ChinaHungaryIBRD onlyIcelandIDA & IBRD totalIDA blendIDA onlyIDA totalIndiaIndonesiaIran, Islamic Rep.IraqIrelandIsraelItalyJamaicaJapanJordanKazakhstanKenyaKiribatiKorea, Dem. People’s Rep.Korea, Rep.KuwaitKyrgyz RepublicLao PDRLate-demographic dividendLatin America & Caribbean Latin America & Caribbean (excluding high income)Latin America & the Caribbean (IDA & IBRD countries)LatviaLeast developed countries: UN classificationLebanonLesothoLiberiaLibyaLiechtensteinLithuaniaLow & middle incomeLow incomeLower middle incomeLuxembourgMacao SAR, ChinaMacedonia, FYRMadagascarMalawiMalaysiaMaldivesMaliMaltaMarshall IslandsMauritaniaMauritiusMexicoMicronesia, Fed. Sts.Middle East & North AfricaMiddle East & North Africa (excluding high income)Middle East & North Africa (IDA & IBRD countries)Middle incomeMoldovaMongoliaMontenegroMoroccoMozambiqueMyanmarNamibiaNauruNepalNetherlandsNew CaledoniaNew ZealandNicaraguaNigerNigeriaNorth AmericaNorwayOECD membersOmanOther small statesPacific island small statesPakistanPanamaPapua New GuineaParaguayPeruPhilippinesPolandPortugalPost-demographic dividendPre-demographic dividendPuerto RicoQatarRomaniaRussian FederationRwandaSamoaSao Tome and PrincipeSaudi ArabiaSenegalSerbiaSeychellesSierra LeoneSingaporeSlovak RepublicSloveniaSmall statesSolomon IslandsSomaliaSouth AfricaSouth AsiaSouth Asia (IDA & IBRD)SpainSri LankaSt. Kitts and NevisSt. LuciaSt. Vincent and the GrenadinesSub-Saharan Africa Sub-Saharan Africa (excluding high income)Sub-Saharan Africa (IDA & IBRD countries)SudanSurinameSwazilandSwedenSwitzerlandSyrian Arab RepublicTajikistanTanzaniaThailandTimor-LesteTogoTongaTrinidad and TobagoTunisiaTurkeyTurkmenistanTuvaluUgandaUkraineUnited Arab EmiratesUnited KingdomUnited StatesUpper middle incomeUruguayUzbekistanVanuatuVenezuela, RBVietnamVirgin Islands (U.S.)West Bank and GazaWorldYemen, Rep.ZambiaZimbabwe Timeline:
This timeline shows a graph from 1962 to 2014 of Pacific island small states. No data until 1961. Number of actual observations by date: 53.
Source name:
World Development Indicators
Source organization:
Food and Agriculture Organization, electronic files and web site.
Categories, topics:
Agriculture & Rural Development
Last updated:
apr 23, 2017
Indicators value changes by year
Minimum:
53.785
jan 1, 1962
Maximum:
105.347
jan 1, 2014
At the date of observation
Value
Absolute change
Change from previous value
jan 1, 1962
53.785
+53.785
0.0%
jan 1, 1963
58.769
+4.984
9.27%
jan 1, 1964
64.367
+5.597
9.52%
jan 1, 1965
65.782
+1.416
2.2%
jan 1, 1966
61.553
-4.23
-6.43%
jan 1, 1967
62.146
+0.594
0.96%
jan 1, 1968
63.348
+1.201
1.93%
jan 1, 1969
67.75
+4.402
6.95%
jan 1, 1970
67.854
+0.104
0.15%
jan 1, 1971
69.418
+1.564
2.3%
jan 1, 1972
69.672
+0.254
0.37%
jan 1, 1973
63.455
-6.217
-8.92%
jan 1, 1974
65.731
+2.276
3.59%
jan 1, 1975
67.059
+1.327
2.02%
jan 1, 1976
66.695
-0.364
-0.54%
jan 1, 1977
69.225
+2.531
3.79%
jan 1, 1978
74.903
+5.678
8.2%
jan 1, 1979
76.169
+1.266
1.69%
jan 1, 1980
86.713
+10.544
13.84%
jan 1, 1981
82.629
-4.084
-4.71%
jan 1, 1982
89.783
+7.154
8.66%
jan 1, 1983
89.159
-0.624
-0.7%
jan 1, 1984
77.318
-11.841
-13.28%
jan 1, 1985
96.26
+18.942
24.5%
jan 1, 1986
88.563
-7.697
-8.0%
jan 1, 1987
97.853
+9.29
10.49%
jan 1, 1988
85.086
-12.767
-13.05%
jan 1, 1989
85.576
+0.49
0.58%
jan 1, 1990
90.937
+5.361
6.26%
jan 1, 1991
94.001
+3.064
3.37%
jan 1, 1992
86.874
-7.127
-7.58%
jan 1, 1993
88.455
+1.581
1.82%
jan 1, 1994
90.557
+2.102
2.38%
jan 1, 1995
92.095
+1.538
1.7%
jan 1, 1996
94.882
+2.787
3.03%
jan 1, 1997
96.162
+1.28
1.35%
jan 1, 1998
97.099
+0.938
0.98%
jan 1, 1999
89.789
-7.311
-7.53%
jan 1, 2000
94.019
+4.23
4.71%
jan 1, 2001
94.086
+0.067
0.07%
jan 1, 2002
89.186
-4.9
-5.21%
jan 1, 2003
90.973
+1.786
2.0%
jan 1, 2004
88.717
-2.256
-2.48%
jan 1, 2005
96.258
+7.541
8.5%
jan 1, 2006
99.805
+3.547
3.68%
jan 1, 2007
103.938
+4.133
4.14%
jan 1, 2008
103.355
-0.582
-0.56%
jan 1, 2009
104.599
+1.244
1.2%
jan 1, 2010
99.683
-4.916
-4.7%
jan 1, 2011
101.297
+1.613
1.62%
jan 1, 2012
104.907
+3.611
3.56%
jan 1, 2013
103.317
-1.591
-1.52%
jan 1, 2014
105.347
+2.031
1.97%
Ranking of countries by current statistics by years


Comments: