29
/
en
AIzaSyAYiBZKx7MnpbEhh9jyipgxe19OcubqV5w
April 1, 2024
33582
European Union
EUU
false
2
1
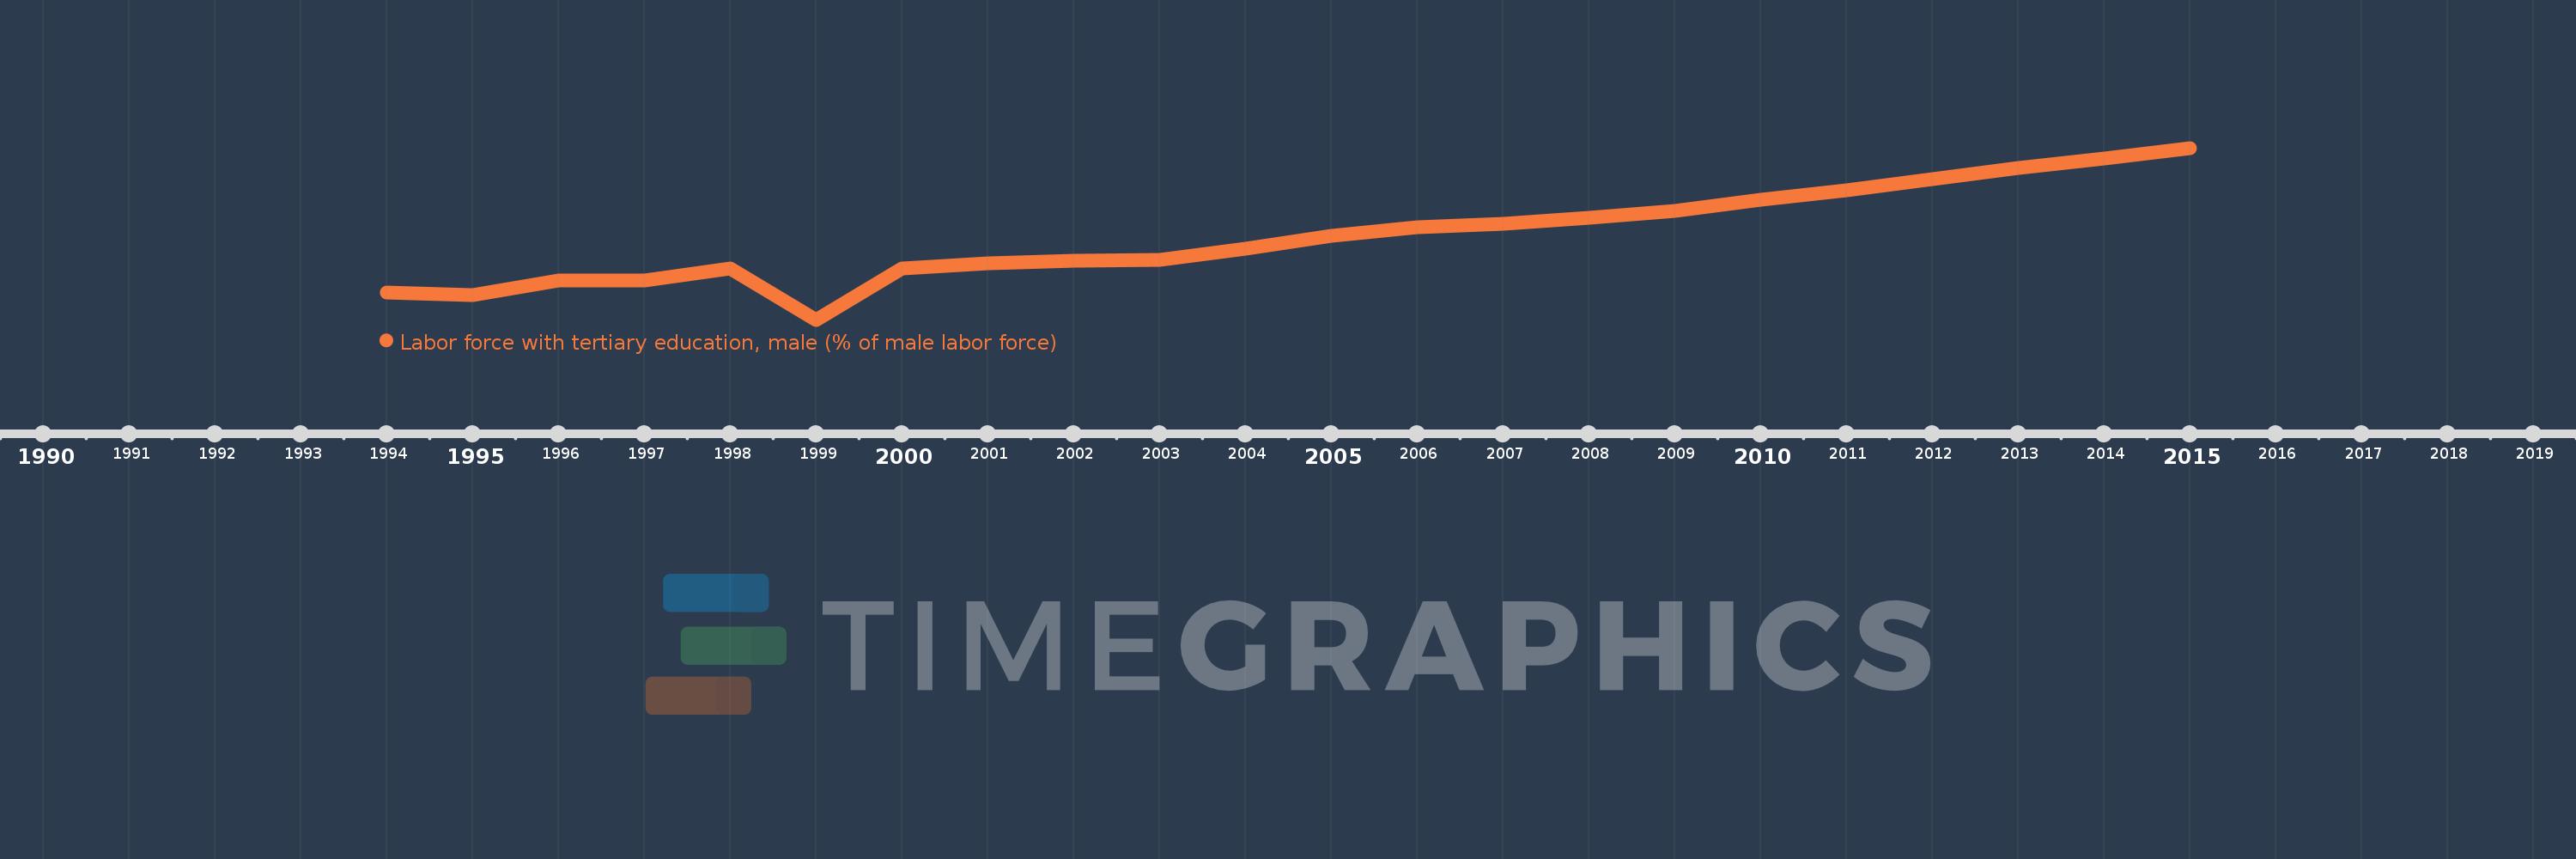
Labor force with tertiary education, male (% of male labor force)
2015,2014,2013,2012,2011,2010,2009,2008,2007,2006,2005,2004,2003,2002,2001,2000,1999,1998,1997,1996,1995,1994
This statistics in other country:
Timeline:
This timeline shows a graph from 1994 to 2015 of European Union. No data until 1993. Number of actual observations by date: 22.
Source name:
World Development Indicators
Source organization:
International Labour Organization, Key Indicators of the Labour Market database.
Categories, topics:
Education, Social Protection & Labor, Gender
Last updated:
apr 23, 2017
Indicators value changes by year
Minimum:
15.855
jan 1, 1999
Maximum:
28.372
jan 1, 2015
At the date of observation
Value
Absolute change
Change from previous value
jan 1, 1994
17.848
+17.848
0.0%
jan 1, 1995
17.635
-0.213
-1.19%
jan 1, 1996
18.714
+1.079
6.12%
jan 1, 1997
18.695
-0.019
-0.1%
jan 1, 1998
19.569
+0.875
4.68%
jan 1, 1999
15.855
-3.715
-18.98%
jan 1, 2000
19.62
+3.765
23.75%
jan 1, 2001
19.941
+0.321
1.64%
jan 1, 2002
20.145
+0.204
1.02%
jan 1, 2003
20.191
+0.046
0.23%
jan 1, 2004
21.04
+0.849
4.2%
jan 1, 2005
21.996
+0.957
4.55%
jan 1, 2006
22.616
+0.62
2.82%
jan 1, 2007
22.863
+0.247
1.09%
jan 1, 2008
23.274
+0.411
1.8%
jan 1, 2009
23.784
+0.51
2.19%
jan 1, 2010
24.579
+0.794
3.34%
jan 1, 2011
25.302
+0.724
2.94%
jan 1, 2012
26.129
+0.826
3.27%
jan 1, 2013
26.899
+0.771
2.95%
jan 1, 2014
27.584
+0.685
2.55%
jan 1, 2015
28.372
+0.788
2.86%
Ranking of countries by current statistics by years


Comments: