29
/
en
AIzaSyAYiBZKx7MnpbEhh9jyipgxe19OcubqV5w
April 1, 2024
57227
South Asia
SAS
false
2
1
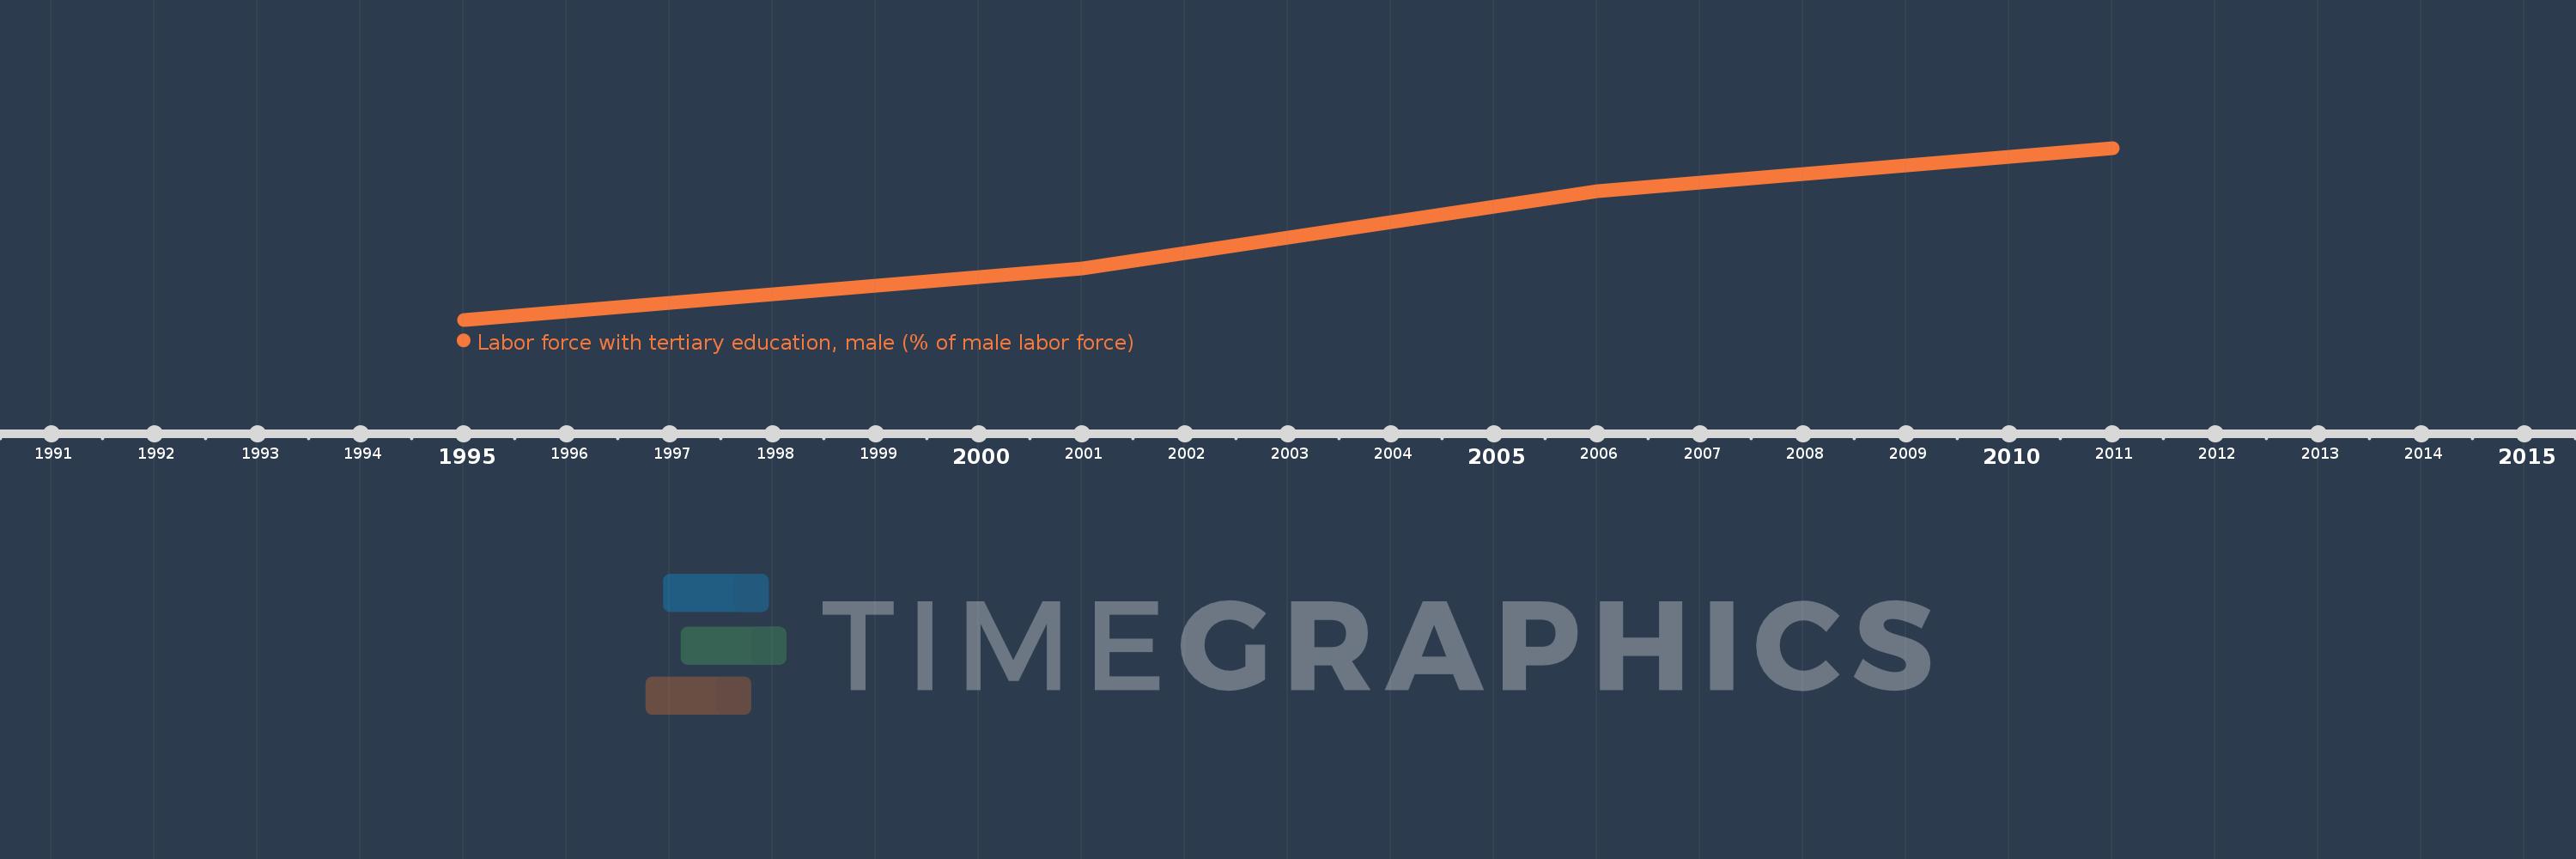
Labor force with tertiary education, male (% of male labor force)
2011,2006,2001,1995
This statistics in other country:
Timeline:
This timeline shows a graph from 1995 to 2011 of South Asia. No data until 1994. Number of actual observations by date: 4.
Source name:
World Development Indicators
Source organization:
International Labour Organization, Key Indicators of the Labour Market database.
Categories, topics:
Education, Social Protection & Labor, Gender
Last updated:
apr 23, 2017
Indicators value changes by year
Maximum:
10.677
jan 1, 2011
At the date of observation
Value
Absolute change
Change from previous value
jan 1, 2001
7.247
+1.447
24.95%
jan 1, 2006
9.458
+2.211
30.5%
jan 1, 2011
10.677
+1.22
12.9%
Ranking of countries by current statistics by years


Comments: