29
/
en
AIzaSyAYiBZKx7MnpbEhh9jyipgxe19OcubqV5w
April 1, 2024
30833
Europe & Central Asia
ECS
false
2
1
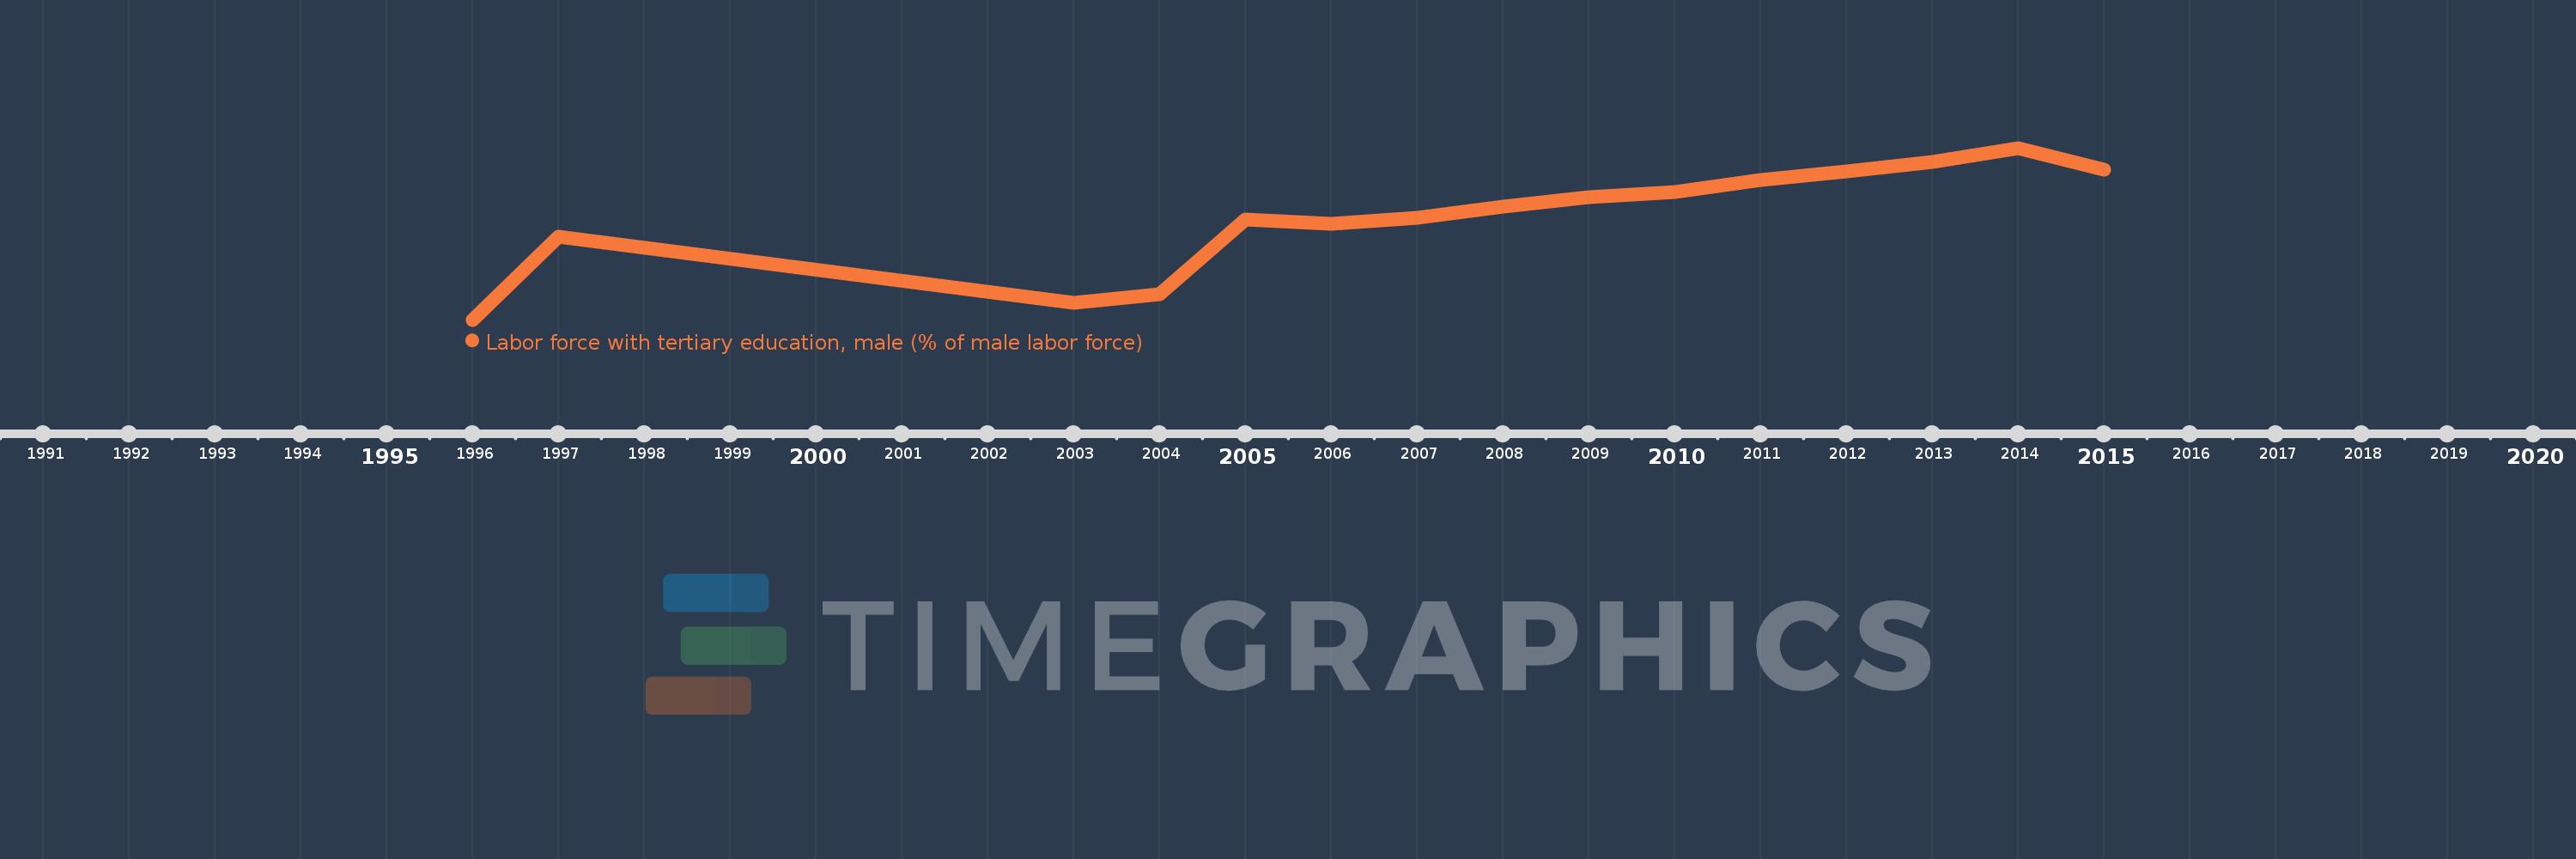
Labor force with tertiary education, male (% of male labor force)
2015,2014,2013,2012,2011,2010,2009,2008,2007,2006,2005,2004,2003,1997,1996
This statistics in other country:
Timeline:
This timeline shows a graph from 1996 to 2015 of Europe & Central Asia. No data until 1995. Number of actual observations by date: 15.
Source name:
World Development Indicators
Source organization:
International Labour Organization, Key Indicators of the Labour Market database.
Categories, topics:
Education, Social Protection & Labor, Gender
Last updated:
apr 23, 2017
Indicators value changes by year
Minimum:
19.319
jan 1, 1996
Maximum:
30.469
jan 1, 2014
At the date of observation
Value
Absolute change
Change from previous value
jan 1, 1996
19.319
+19.319
0.0%
jan 1, 1997
24.726
+5.407
27.99%
jan 1, 2003
20.391
-4.335
-17.53%
jan 1, 2004
20.993
+0.602
2.95%
jan 1, 2005
25.808
+4.815
22.94%
jan 1, 2006
25.531
-0.278
-1.08%
jan 1, 2007
25.914
+0.384
1.5%
jan 1, 2008
26.664
+0.749
2.89%
jan 1, 2009
27.268
+0.604
2.27%
jan 1, 2010
27.587
+0.32
1.17%
jan 1, 2011
28.39
+0.803
2.91%
jan 1, 2012
28.951
+0.561
1.98%
jan 1, 2013
29.578
+0.627
2.16%
jan 1, 2014
30.469
+0.891
3.01%
jan 1, 2015
29.086
-1.382
-4.54%
Ranking of countries by current statistics by years


Comments: