29
/
en
AIzaSyAYiBZKx7MnpbEhh9jyipgxe19OcubqV5w
April 1, 2024
170137
Korea, Rep.
KOR
true
2
1
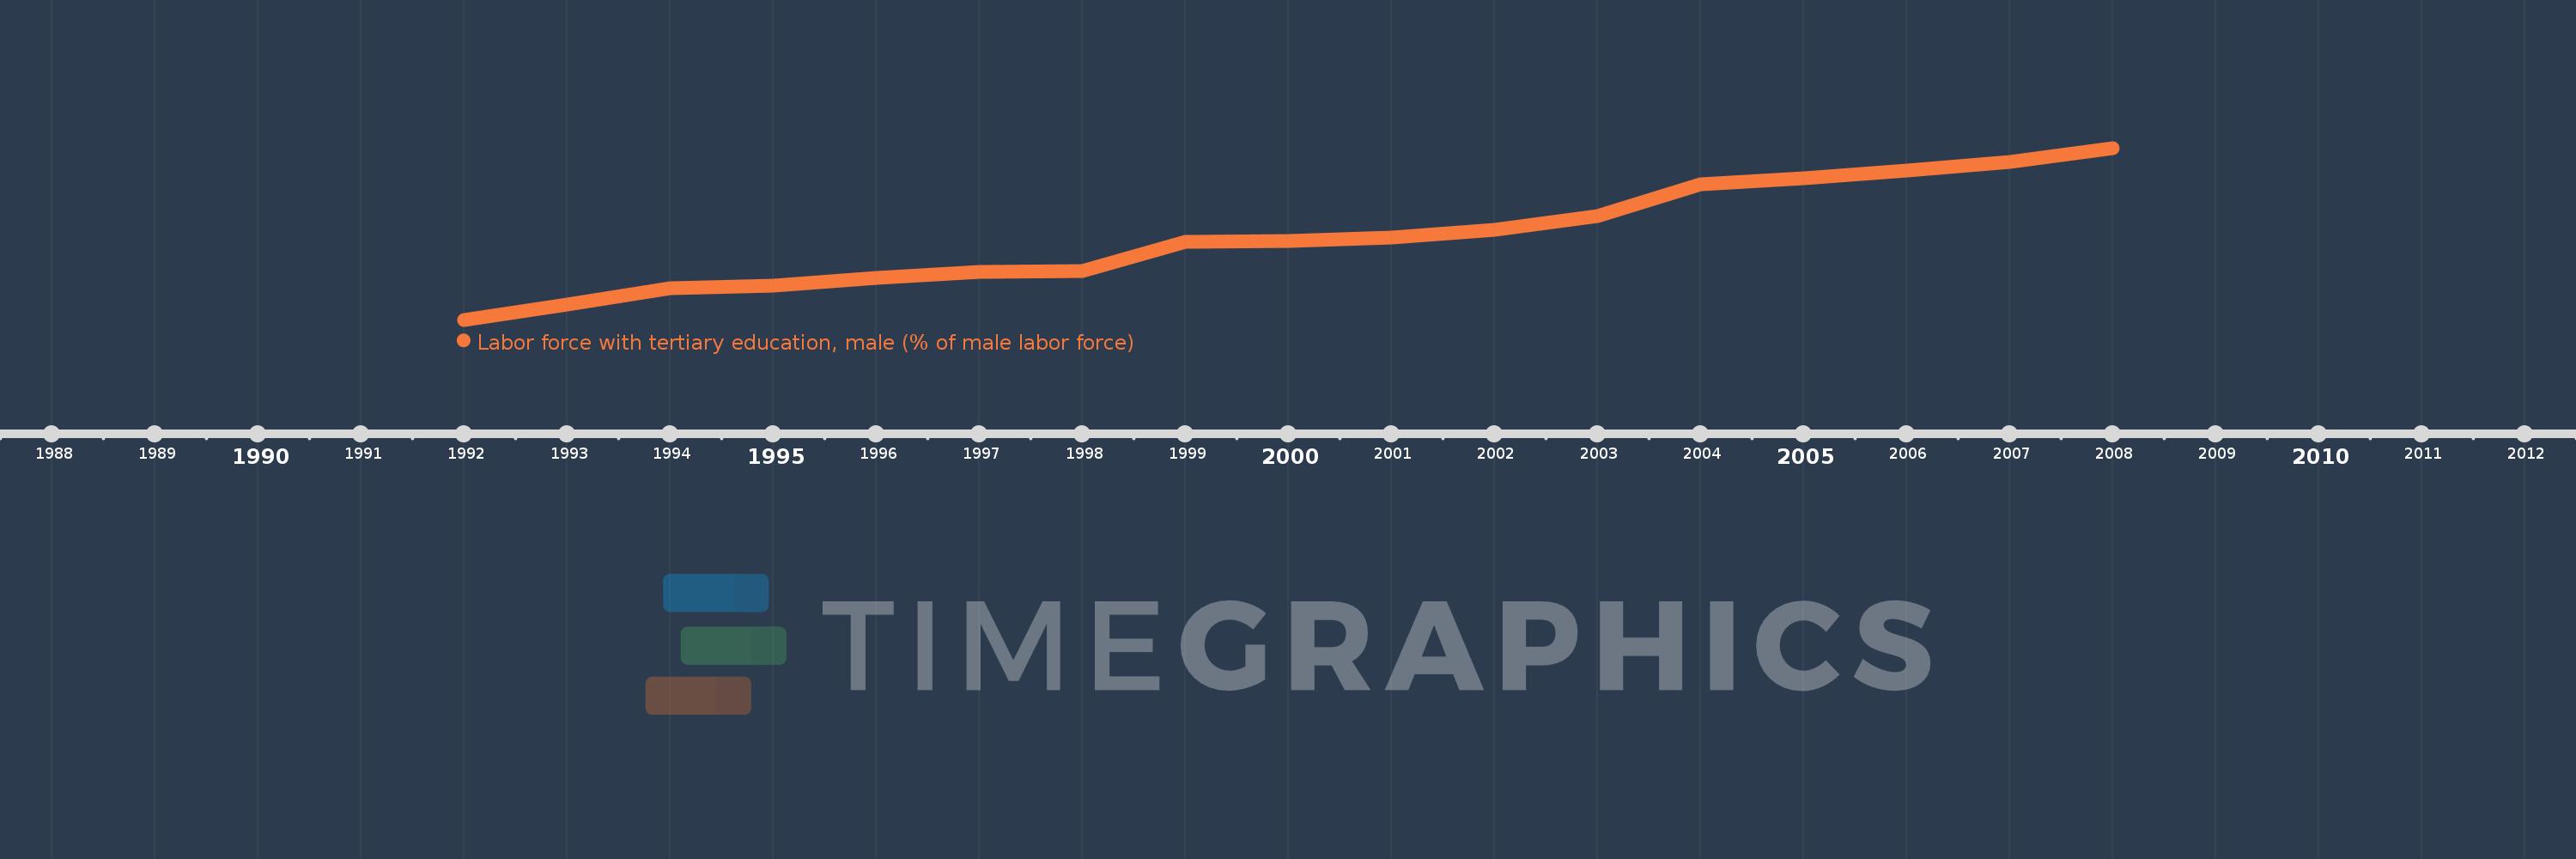
Labor force with tertiary education, male (% of male labor force)
2008,2007,2006,2005,2004,2003,2002,2001,2000,1999,1998,1997,1996,1995,1994,1993,1992
This statistics in other country:
Timeline:
This timeline shows a graph from 1992 to 2008 of Korea, Rep.. No data until 1991. Number of actual observations by date: 17.
Source name:
World Development Indicators
Source organization:
International Labour Organization, Key Indicators of the Labour Market database.
Categories, topics:
Education, Social Protection & Labor, Gender
Last updated:
apr 23, 2017
Indicators value changes by year
At the date of observation
Value
Absolute change
Change from previous value
jan 1, 1992
18.3
+18.3
0.0%
jan 1, 1993
20.1
+1.8
9.84%
jan 1, 1994
21.9
+1.8
8.96%
jan 1, 1995
22.2
+0.3
1.37%
jan 1, 1996
23.1
+0.9
4.05%
jan 1, 1997
23.8
+0.7
3.03%
jan 1, 1998
23.9
+0.1
0.42%
jan 1, 1999
27.3
+3.4
14.23%
jan 1, 2000
27.4
+0.1
0.37%
jan 1, 2001
27.8
+0.4
1.46%
jan 1, 2002
28.7
+0.9
3.24%
jan 1, 2003
30.2
+1.5
5.23%
jan 1, 2004
33.9
+3.7
12.25%
jan 1, 2005
34.6
+0.7
2.06%
jan 1, 2006
35.5
+0.9
2.6%
jan 1, 2007
36.5
+1.0
2.82%
jan 1, 2008
38.1
+1.6
4.38%
Ranking of countries by current statistics by years


Comments: