29
/
en
AIzaSyAYiBZKx7MnpbEhh9jyipgxe19OcubqV5w
April 1, 2024
32302
Europe & Central Asia (excluding high income)
ECA
false
2
1
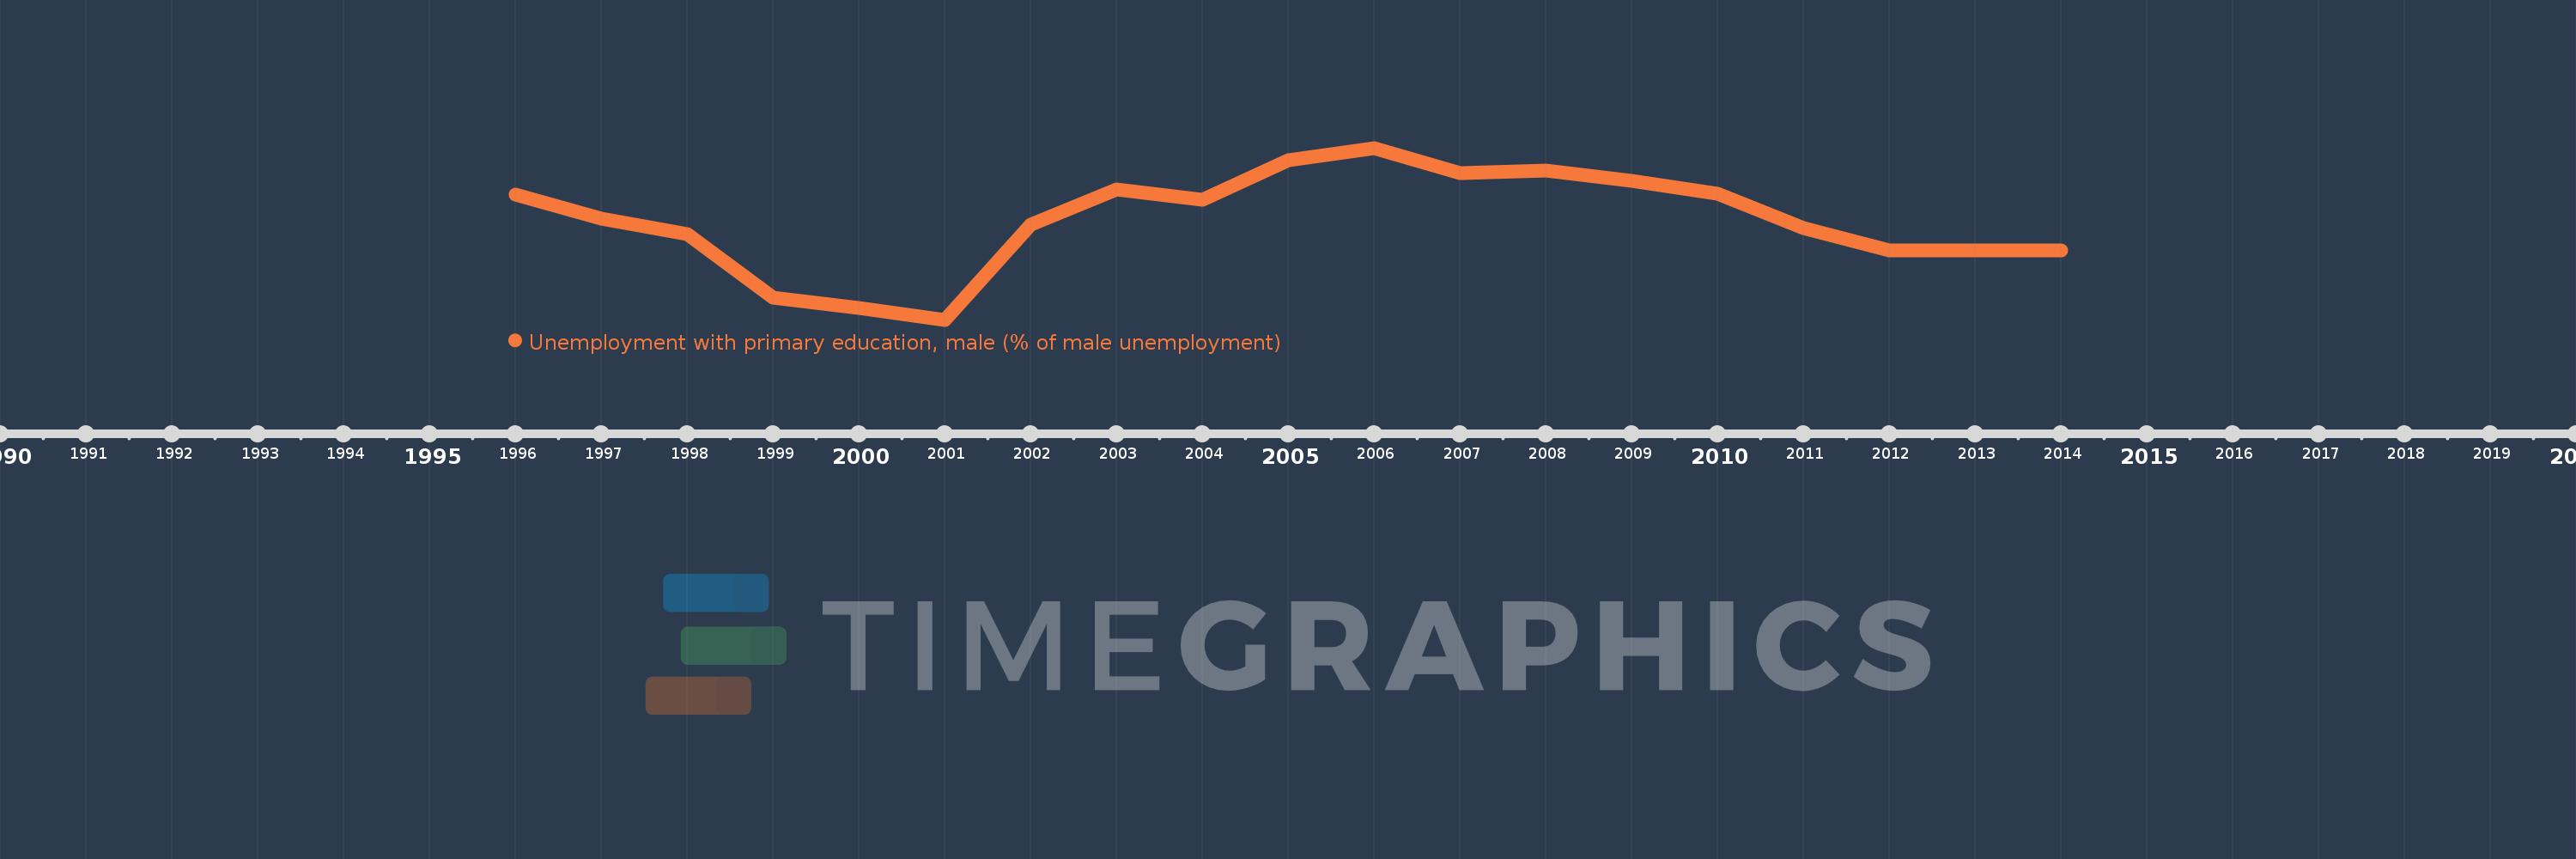
Unemployment with primary education, male (% of male unemployment)
2014,2012,2011,2010,2009,2008,2007,2006,2005,2004,2003,2002,2001,2000,1999,1998,1997,1996
This statistics in other country:
Timeline:
This timeline shows a graph from 1996 to 2014 of Europe & Central Asia (excluding high income). No data until 1995. Number of actual observations by date: 18.
Source name:
World Development Indicators
Source organization:
International Labour Organization, Key Indicators of the Labour Market database.
Categories, topics:
Social Protection & Labor, Gender
Last updated:
apr 23, 2017
Indicators value changes by year
Minimum:
23.466
jan 1, 2001
Maximum:
30.311
jan 1, 2006
At the date of observation
Value
Absolute change
Change from previous value
jan 1, 1996
28.466
+28.466
0.0%
jan 1, 1997
27.48
-0.985
-3.46%
jan 1, 1998
26.871
-0.609
-2.22%
jan 1, 1999
24.344
-2.527
-9.4%
jan 1, 2000
23.929
-0.415
-1.71%
jan 1, 2001
23.466
-0.463
-1.93%
jan 1, 2002
27.262
+3.796
16.18%
jan 1, 2003
28.672
+1.41
5.17%
jan 1, 2004
28.253
-0.419
-1.46%
jan 1, 2005
29.823
+1.57
5.56%
jan 1, 2006
30.311
+0.488
1.64%
jan 1, 2007
29.302
-1.009
-3.33%
jan 1, 2008
29.411
+0.109
0.37%
jan 1, 2009
28.984
-0.427
-1.45%
jan 1, 2010
28.496
-0.488
-1.68%
jan 1, 2011
27.102
-1.393
-4.89%
jan 1, 2012
26.217
-0.885
-3.27%
jan 1, 2014
26.221
+0.004
0.02%
Ranking of countries by current statistics by years


Comments: