29
/
en
AIzaSyAYiBZKx7MnpbEhh9jyipgxe19OcubqV5w
April 1, 2024
36280
High income
HIC
false
2
1
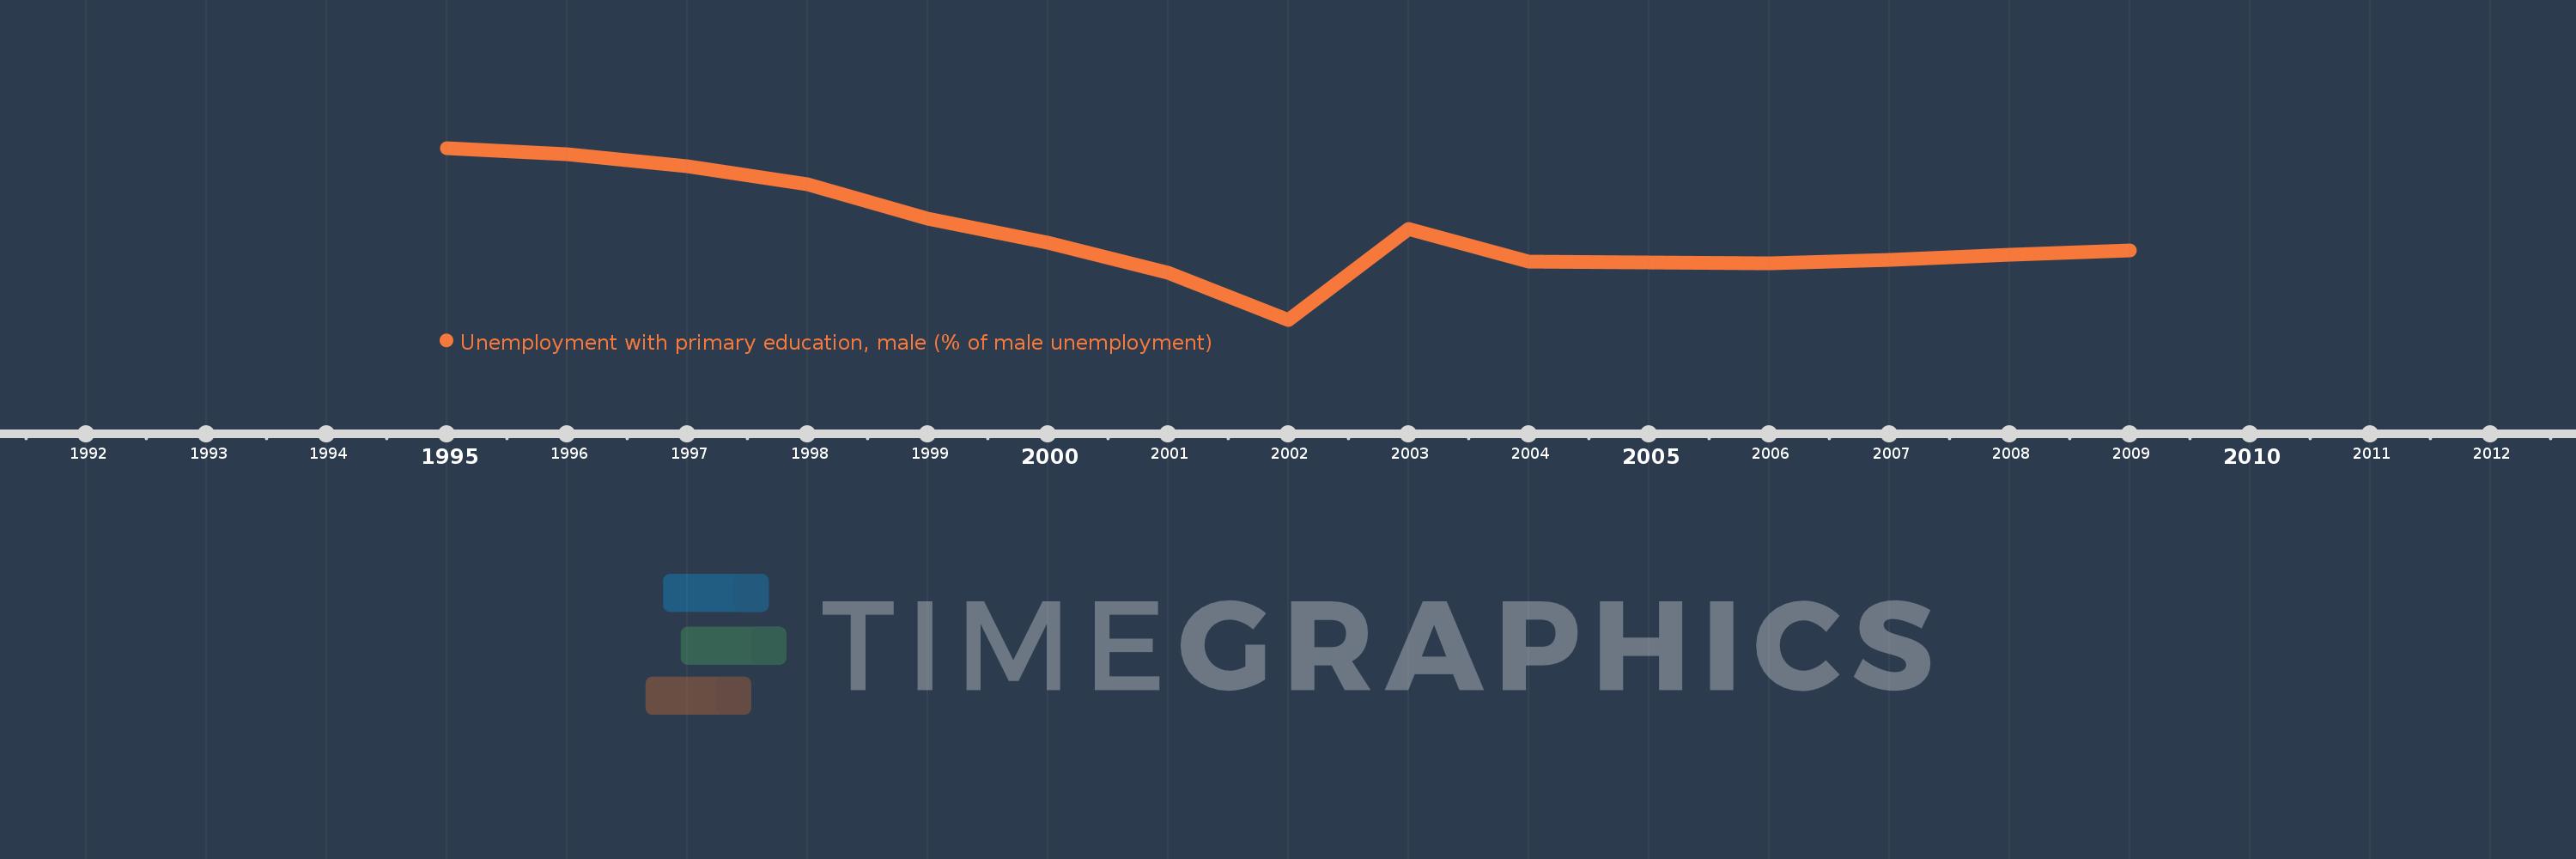
Unemployment with primary education, male (% of male unemployment)
2009,2008,2007,2006,2005,2004,2003,2002,2001,2000,1999,1998,1997,1996,1995
This statistics in other country:
Timeline:
This timeline shows a graph from 1995 to 2009 of High income. No data until 1994. Number of actual observations by date: 15.
Source name:
World Development Indicators
Source organization:
International Labour Organization, Key Indicators of the Labour Market database.
Categories, topics:
Social Protection & Labor, Gender
Last updated:
apr 23, 2017
Indicators value changes by year
Minimum:
31.489
jan 1, 2002
Maximum:
40.574
jan 1, 1995
At the date of observation
Value
Absolute change
Change from previous value
jan 1, 1995
40.574
+40.574
0.0%
jan 1, 1996
40.257
-0.318
-0.78%
jan 1, 1997
39.59
-0.666
-1.66%
jan 1, 1998
38.652
-0.938
-2.37%
jan 1, 1999
36.833
-1.819
-4.71%
jan 1, 2000
35.545
-1.288
-3.5%
jan 1, 2001
33.986
-1.558
-4.38%
jan 1, 2002
31.489
-2.497
-7.35%
jan 1, 2003
36.287
+4.797
15.24%
jan 1, 2004
34.562
-1.725
-4.75%
jan 1, 2005
34.514
-0.048
-0.14%
jan 1, 2006
34.471
-0.043
-0.12%
jan 1, 2007
34.667
+0.196
0.57%
jan 1, 2008
34.918
+0.252
0.73%
jan 1, 2009
35.149
+0.23
0.66%
Ranking of countries by current statistics by years


Comments: