29
/
en
AIzaSyAYiBZKx7MnpbEhh9jyipgxe19OcubqV5w
April 1, 2024
278377
Uruguay
URY
true
2
1
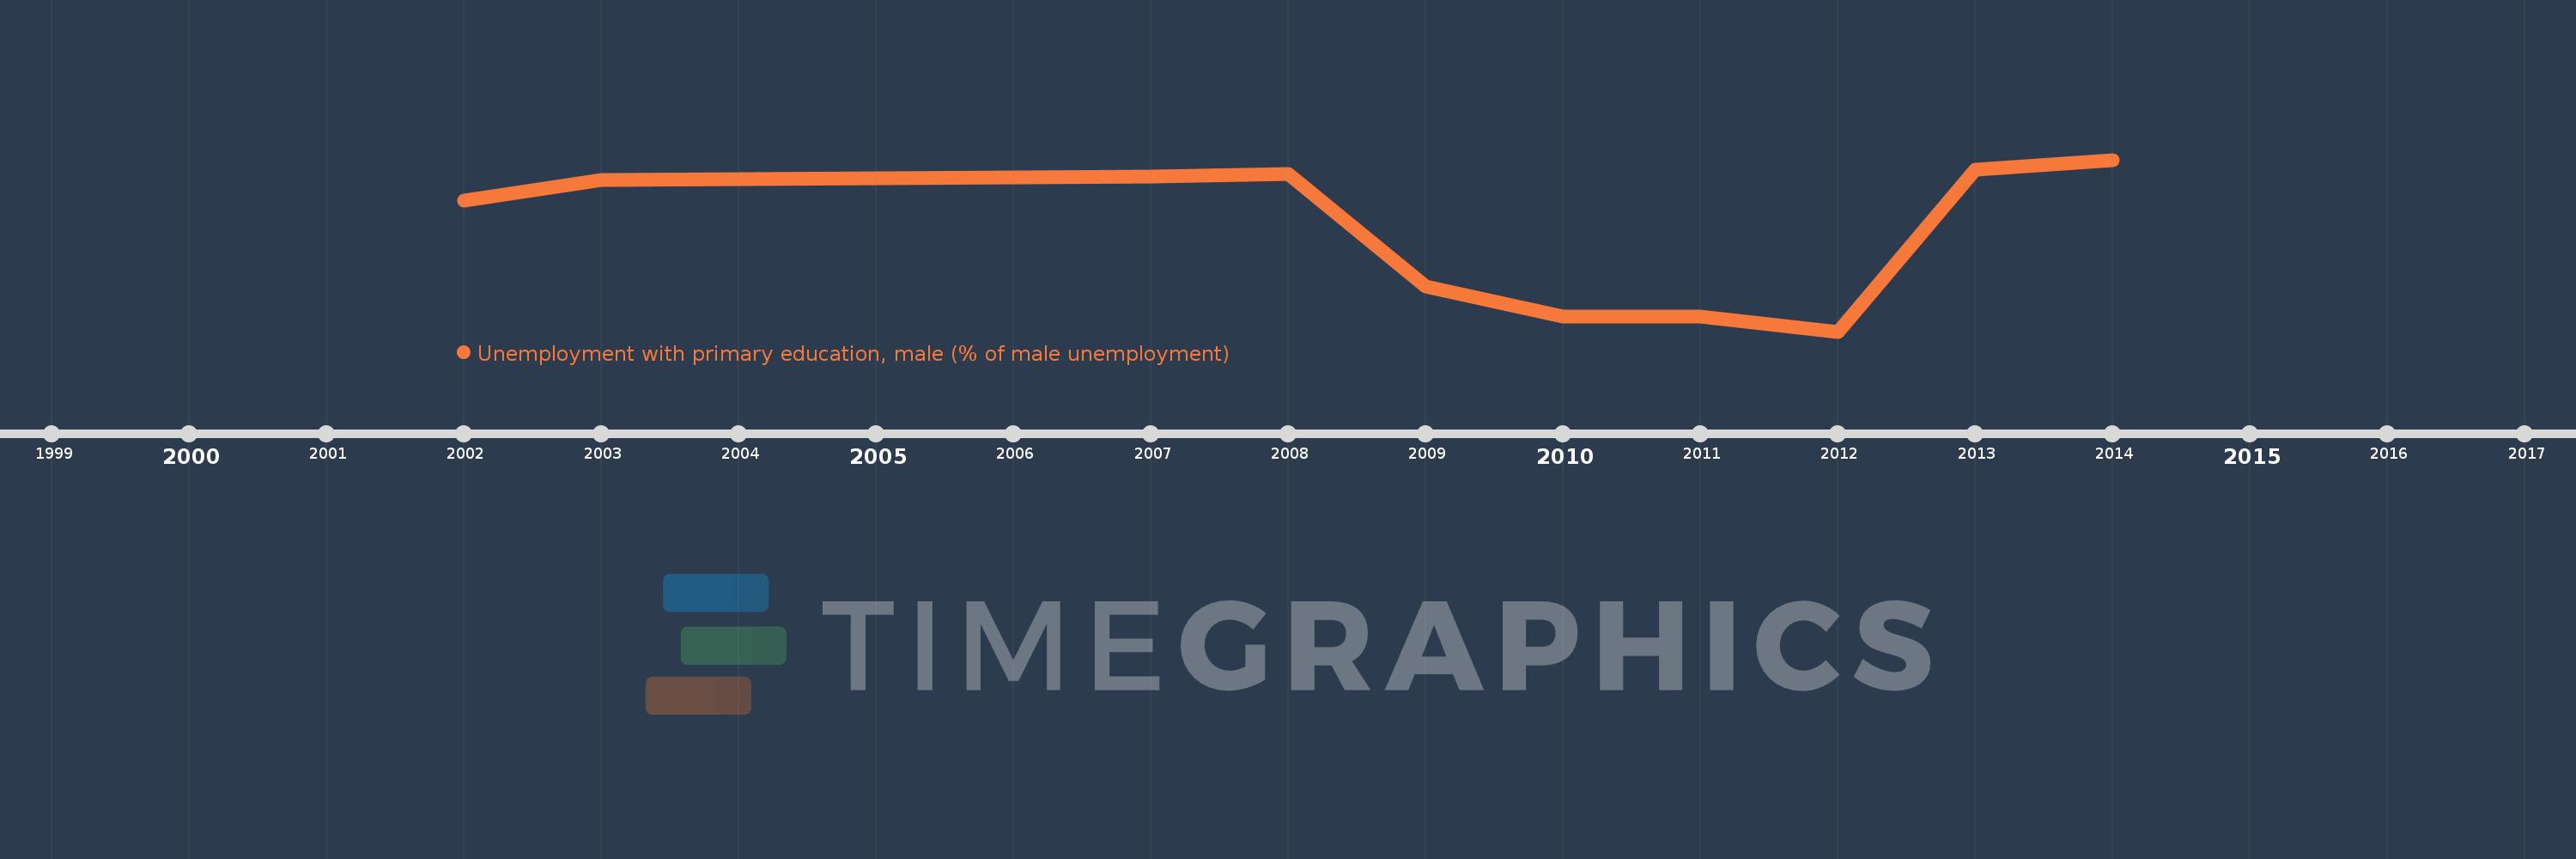
Unemployment with primary education, male (% of male unemployment)
2014,2013,2012,2011,2010,2009,2008,2007,2003,2002
This statistics in other country:
Timeline:
This timeline shows a graph from 2002 to 2014 of Uruguay. No data until 2001. Number of actual observations by date: 10.
Source name:
World Development Indicators
Source organization:
International Labour Organization, Key Indicators of the Labour Market database.
Categories, topics:
Social Protection & Labor, Gender
Last updated:
apr 23, 2017
Indicators value changes by year
At the date of observation
Value
Absolute change
Change from previous value
jan 1, 2002
53.1
+53.1
0.0%
jan 1, 2003
60.0
+6.9
12.99%
jan 1, 2007
61.0
+1.0
1.67%
jan 1, 2008
61.8
+0.8
1.31%
jan 1, 2009
25.3
-36.5
-59.06%
jan 1, 2010
15.3
-10.0
-39.53%
jan 1, 2011
15.5
+0.2
1.31%
jan 1, 2012
10.5
-5.0
-32.26%
jan 1, 2013
63.3
+52.8
502.86%
jan 1, 2014
66.5
+3.2
5.06%
Ranking of countries by current statistics by years


Comments: