29
/
en
AIzaSyAYiBZKx7MnpbEhh9jyipgxe19OcubqV5w
April 1, 2024
26212
Central Europe and the Baltics
CEB
false
2
1
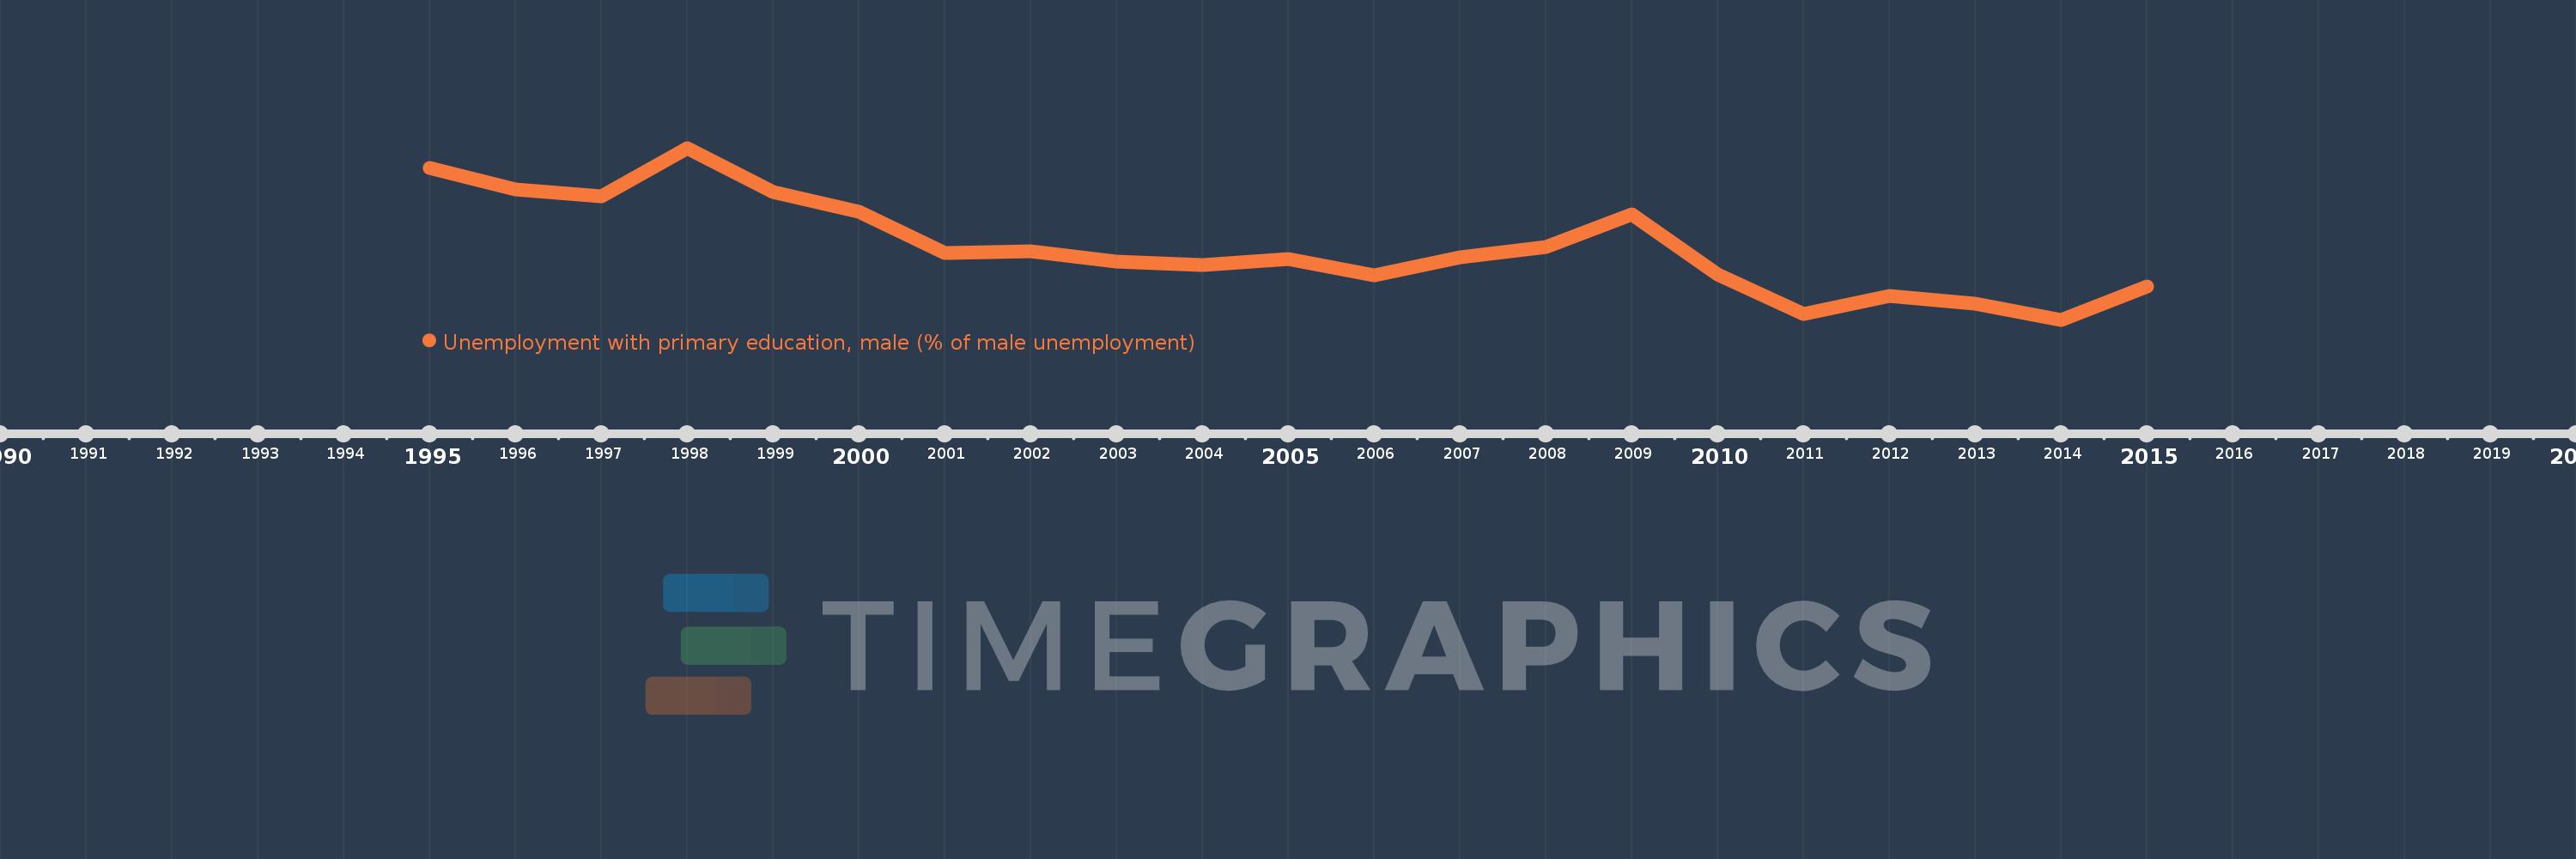
Unemployment with primary education, male (% of male unemployment)
2015,2014,2013,2012,2011,2010,2009,2008,2007,2006,2005,2004,2003,2002,2001,2000,1999,1998,1997,1996,1995
This statistics in other country:
Timeline:
This timeline shows a graph from 1995 to 2015 of Central Europe and the Baltics. No data until 1994. Number of actual observations by date: 21.
Source name:
World Development Indicators
Source organization:
International Labour Organization, Key Indicators of the Labour Market database.
Categories, topics:
Social Protection & Labor, Gender
Last updated:
apr 23, 2017
Indicators value changes by year
Minimum:
20.656
jan 1, 2014
Maximum:
30.419
jan 1, 1998
At the date of observation
Value
Absolute change
Change from previous value
jan 1, 1995
29.3
+29.3
0.0%
jan 1, 1996
28.078
-1.222
-4.17%
jan 1, 1997
27.657
-0.421
-1.5%
jan 1, 1998
30.419
+2.761
9.98%
jan 1, 1999
27.918
-2.5
-8.22%
jan 1, 2000
26.772
-1.147
-4.11%
jan 1, 2001
24.464
-2.307
-8.62%
jan 1, 2002
24.525
+0.061
0.25%
jan 1, 2003
23.972
-0.552
-2.25%
jan 1, 2004
23.786
-0.186
-0.78%
jan 1, 2005
24.121
+0.334
1.41%
jan 1, 2006
23.178
-0.942
-3.91%
jan 1, 2007
24.2
+1.022
4.41%
jan 1, 2008
24.78
+0.581
2.4%
jan 1, 2009
26.651
+1.87
7.55%
jan 1, 2010
23.213
-3.438
-12.9%
jan 1, 2011
21.003
-2.21
-9.52%
jan 1, 2012
22.01
+1.007
4.79%
jan 1, 2013
21.593
-0.417
-1.89%
jan 1, 2014
20.656
-0.937
-4.34%
jan 1, 2015
22.55
+1.894
9.17%
Ranking of countries by current statistics by years


Comments: