29
/
en
AIzaSyAYiBZKx7MnpbEhh9jyipgxe19OcubqV5w
April 1, 2024
31862
Europe & Central Asia (excluding high income)
ECA
false
2
1
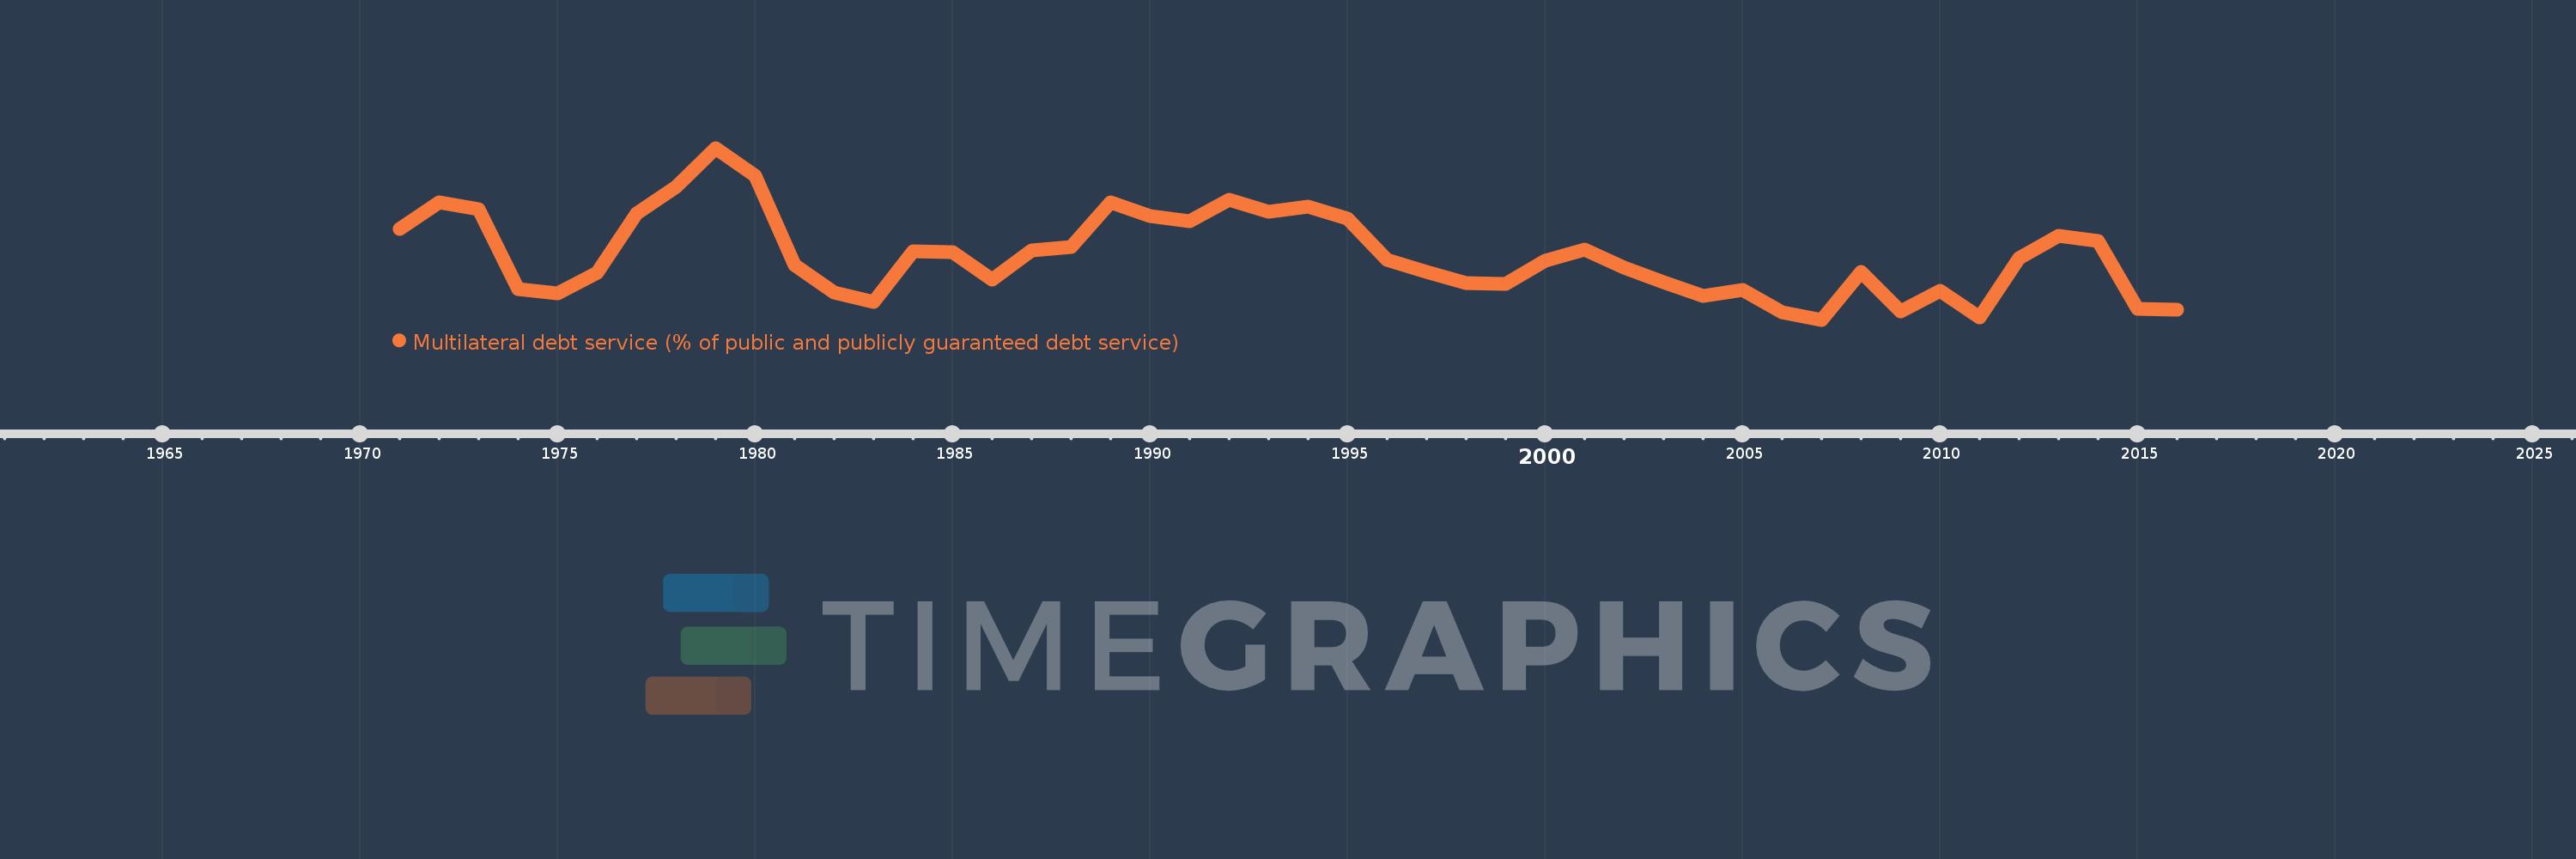
Multilateral debt service (% of public and publicly guaranteed debt service)
2016,2015,2014,2013,2012,2011,2010,2009,2008,2007,2006,2005,2004,2003,2002,2001,2000,1999,1998,1997,1996,1995,1994,1993,1992,1991,1990,1989,1988,1987,1986,1985,1984,1983,1982,1981,1980,1979,1978,1977,1976,1975,1974,1973,1972,1971
This statistics in other country:
Timeline:
This timeline shows a graph from 1971 to 2016 of Europe & Central Asia (excluding high income). No data until 1970. Number of actual observations by date: 46.
Source name:
World Development Indicators
Source organization:
World Bank, International Debt Statistics.
Categories, topics:
External Debt
Last updated:
apr 23, 2017
Indicators value changes by year
Maximum:
29.487
jan 1, 1979
At the date of observation
Value
Absolute change
Change from previous value
jan 1, 1971
20.12
+20.12
0.0%
jan 1, 1972
23.195
+3.074
15.28%
jan 1, 1973
22.402
-0.793
-3.42%
jan 1, 1974
13.151
-9.251
-41.3%
jan 1, 1975
12.687
-0.464
-3.53%
jan 1, 1976
15.046
+2.359
18.6%
jan 1, 1977
21.873
+6.827
45.37%
jan 1, 1978
25.026
+3.153
14.42%
jan 1, 1979
29.487
+4.461
17.83%
jan 1, 1980
26.264
-3.224
-10.93%
jan 1, 1981
15.982
-10.282
-39.15%
jan 1, 1982
12.768
-3.214
-20.11%
jan 1, 1983
11.661
-1.106
-8.67%
jan 1, 1984
17.576
+5.915
50.72%
jan 1, 1985
17.489
-0.087
-0.5%
jan 1, 1986
14.276
-3.213
-18.37%
jan 1, 1987
17.599
+3.323
23.28%
jan 1, 1988
18.057
+0.457
2.6%
jan 1, 1989
23.203
+5.147
28.5%
jan 1, 1990
21.658
-1.545
-6.66%
jan 1, 1991
21.043
-0.615
-2.84%
jan 1, 1992
23.512
+2.469
11.73%
jan 1, 1993
22.124
-1.388
-5.9%
jan 1, 1994
22.757
+0.632
2.86%
jan 1, 1995
21.324
-1.432
-6.29%
jan 1, 1996
16.53
-4.795
-22.48%
jan 1, 1997
15.196
-1.334
-8.07%
jan 1, 1998
13.884
-1.311
-8.63%
jan 1, 1999
13.783
-0.101
-0.73%
jan 1, 2000
16.493
+2.71
19.66%
jan 1, 2001
17.77
+1.276
7.74%
jan 1, 2002
15.678
-2.091
-11.77%
jan 1, 2003
13.966
-1.712
-10.92%
jan 1, 2004
12.365
-1.602
-11.47%
jan 1, 2005
13.08
+0.715
5.78%
jan 1, 2006
10.499
-2.581
-19.73%
jan 1, 2007
9.637
-0.862
-8.21%
jan 1, 2008
15.186
+5.549
57.58%
jan 1, 2009
10.586
-4.599
-30.29%
jan 1, 2010
12.998
+2.412
22.79%
jan 1, 2011
9.898
-3.101
-23.85%
jan 1, 2012
16.781
+6.883
69.54%
jan 1, 2013
19.345
+2.564
15.28%
jan 1, 2014
18.718
-0.627
-3.24%
jan 1, 2015
10.865
-7.853
-41.96%
jan 1, 2016
10.771
-0.094
-0.86%
Ranking of countries by current statistics by years


Comments: