29
/
en
AIzaSyAYiBZKx7MnpbEhh9jyipgxe19OcubqV5w
April 1, 2024
230079
Russian Federation
RUS
true
2
1
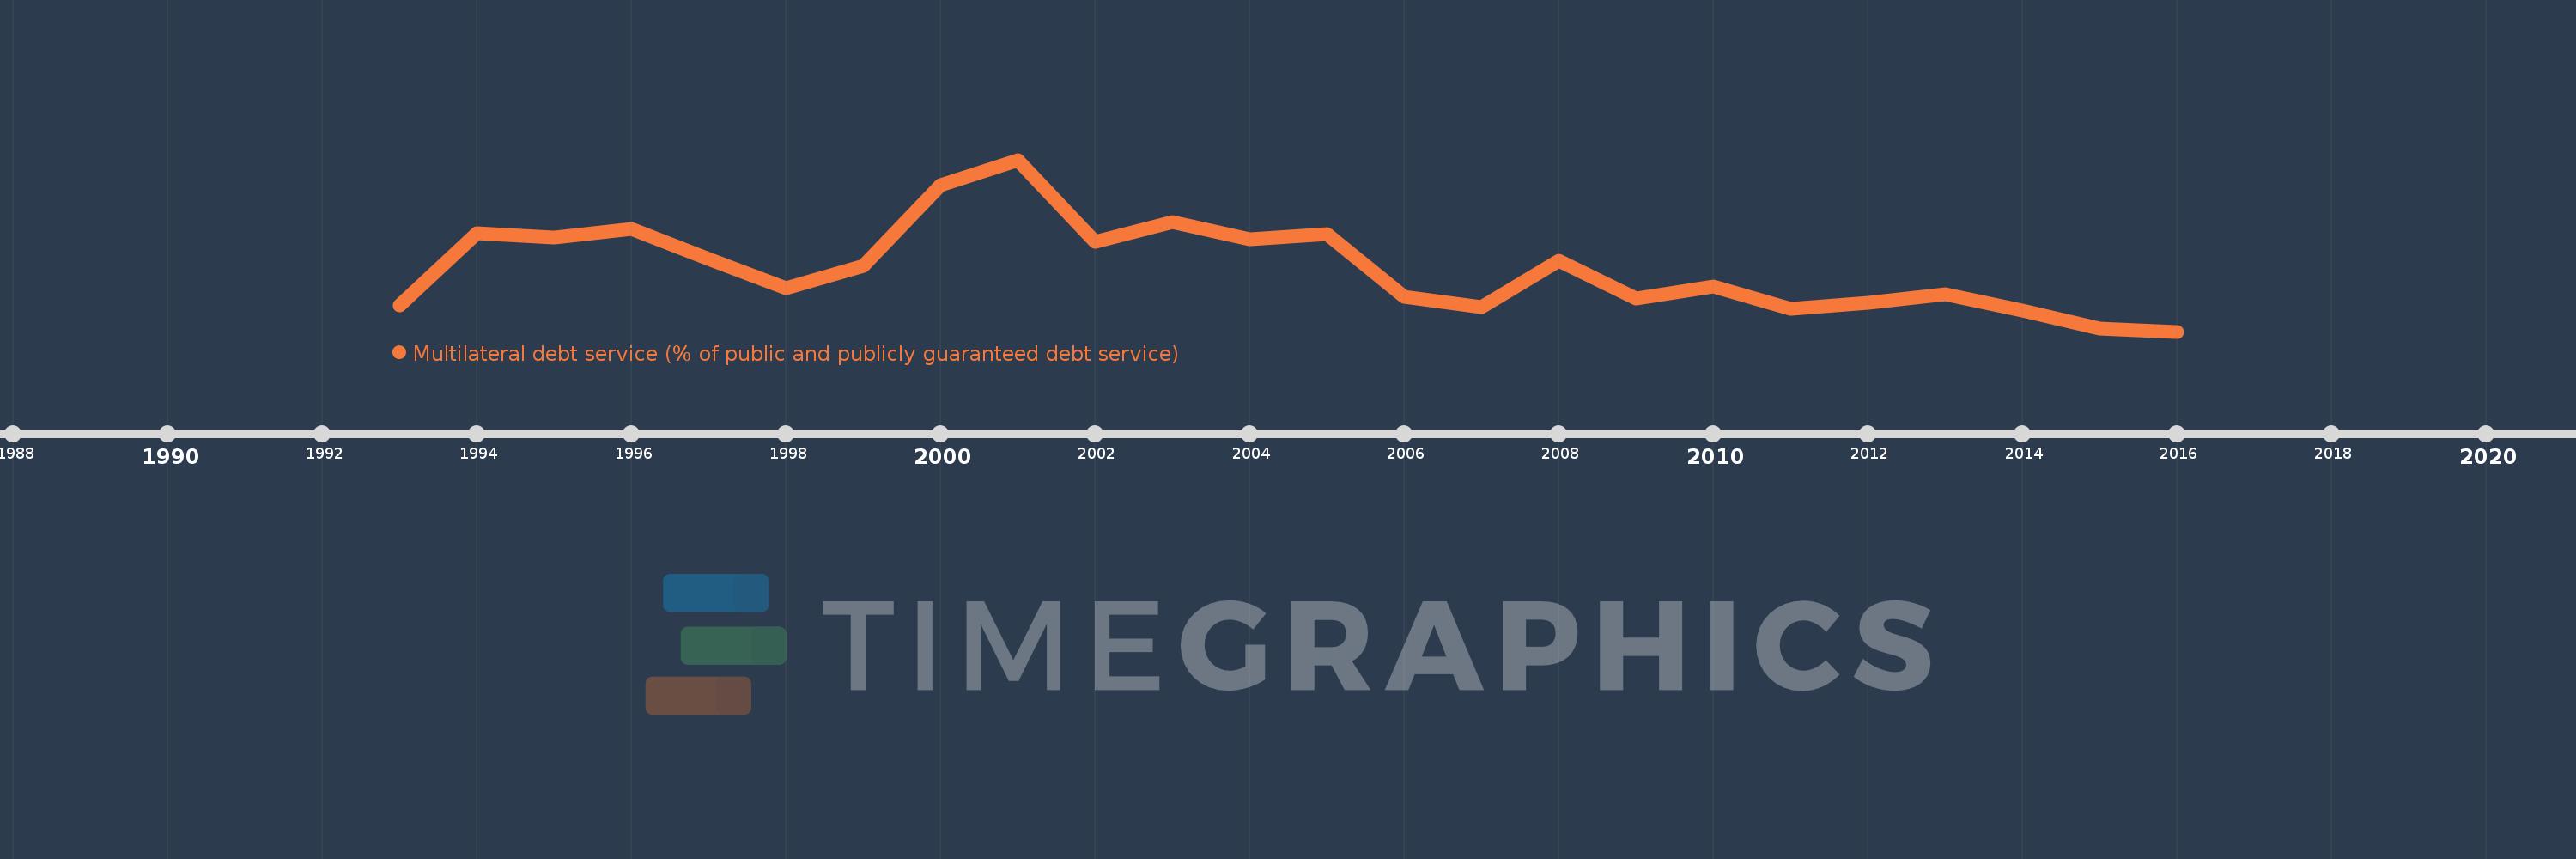
Multilateral debt service (% of public and publicly guaranteed debt service)
2016,2015,2014,2013,2012,2011,2010,2009,2008,2007,2006,2005,2004,2003,2002,2001,2000,1999,1998,1997,1996,1995,1994,1993
This statistics in other country:
Timeline:
This timeline shows a graph from 1993 to 2016 of Russian Federation. No data until 1992. Number of actual observations by date: 24.
Source name:
World Development Indicators
Source organization:
World Bank, International Debt Statistics.
Categories, topics:
External Debt
Last updated:
apr 23, 2017
Indicators value changes by year
Maximum:
15.775
jan 1, 2001
At the date of observation
Value
Absolute change
Change from previous value
jan 1, 1993
2.932
+2.932
0.0%
jan 1, 1994
9.337
+6.405
218.45%
jan 1, 1995
8.901
-0.435
-4.66%
jan 1, 1996
9.662
+0.76
8.54%
jan 1, 1997
7.02
-2.642
-27.34%
jan 1, 1998
4.503
-2.517
-35.86%
jan 1, 1999
6.436
+1.934
42.95%
jan 1, 2000
13.531
+7.095
110.23%
jan 1, 2001
15.775
+2.244
16.58%
jan 1, 2002
8.54
-7.235
-45.87%
jan 1, 2003
10.265
+1.725
20.21%
jan 1, 2004
8.752
-1.513
-14.74%
jan 1, 2005
9.256
+0.504
5.76%
jan 1, 2006
3.702
-5.553
-60.0%
jan 1, 2007
2.836
-0.866
-23.39%
jan 1, 2008
6.914
+4.078
143.76%
jan 1, 2009
3.583
-3.331
-48.18%
jan 1, 2010
4.646
+1.063
29.66%
jan 1, 2011
2.632
-2.014
-43.35%
jan 1, 2012
3.173
+0.542
20.58%
jan 1, 2013
3.956
+0.782
24.66%
jan 1, 2014
2.512
-1.444
-36.5%
jan 1, 2015
0.927
-1.586
-63.12%
jan 1, 2016
0.658
-0.268
-28.97%
Ranking of countries by current statistics by years


Comments: