29
/
en
AIzaSyAYiBZKx7MnpbEhh9jyipgxe19OcubqV5w
April 1, 2024
128558
Eritrea
ERI
true
2
1
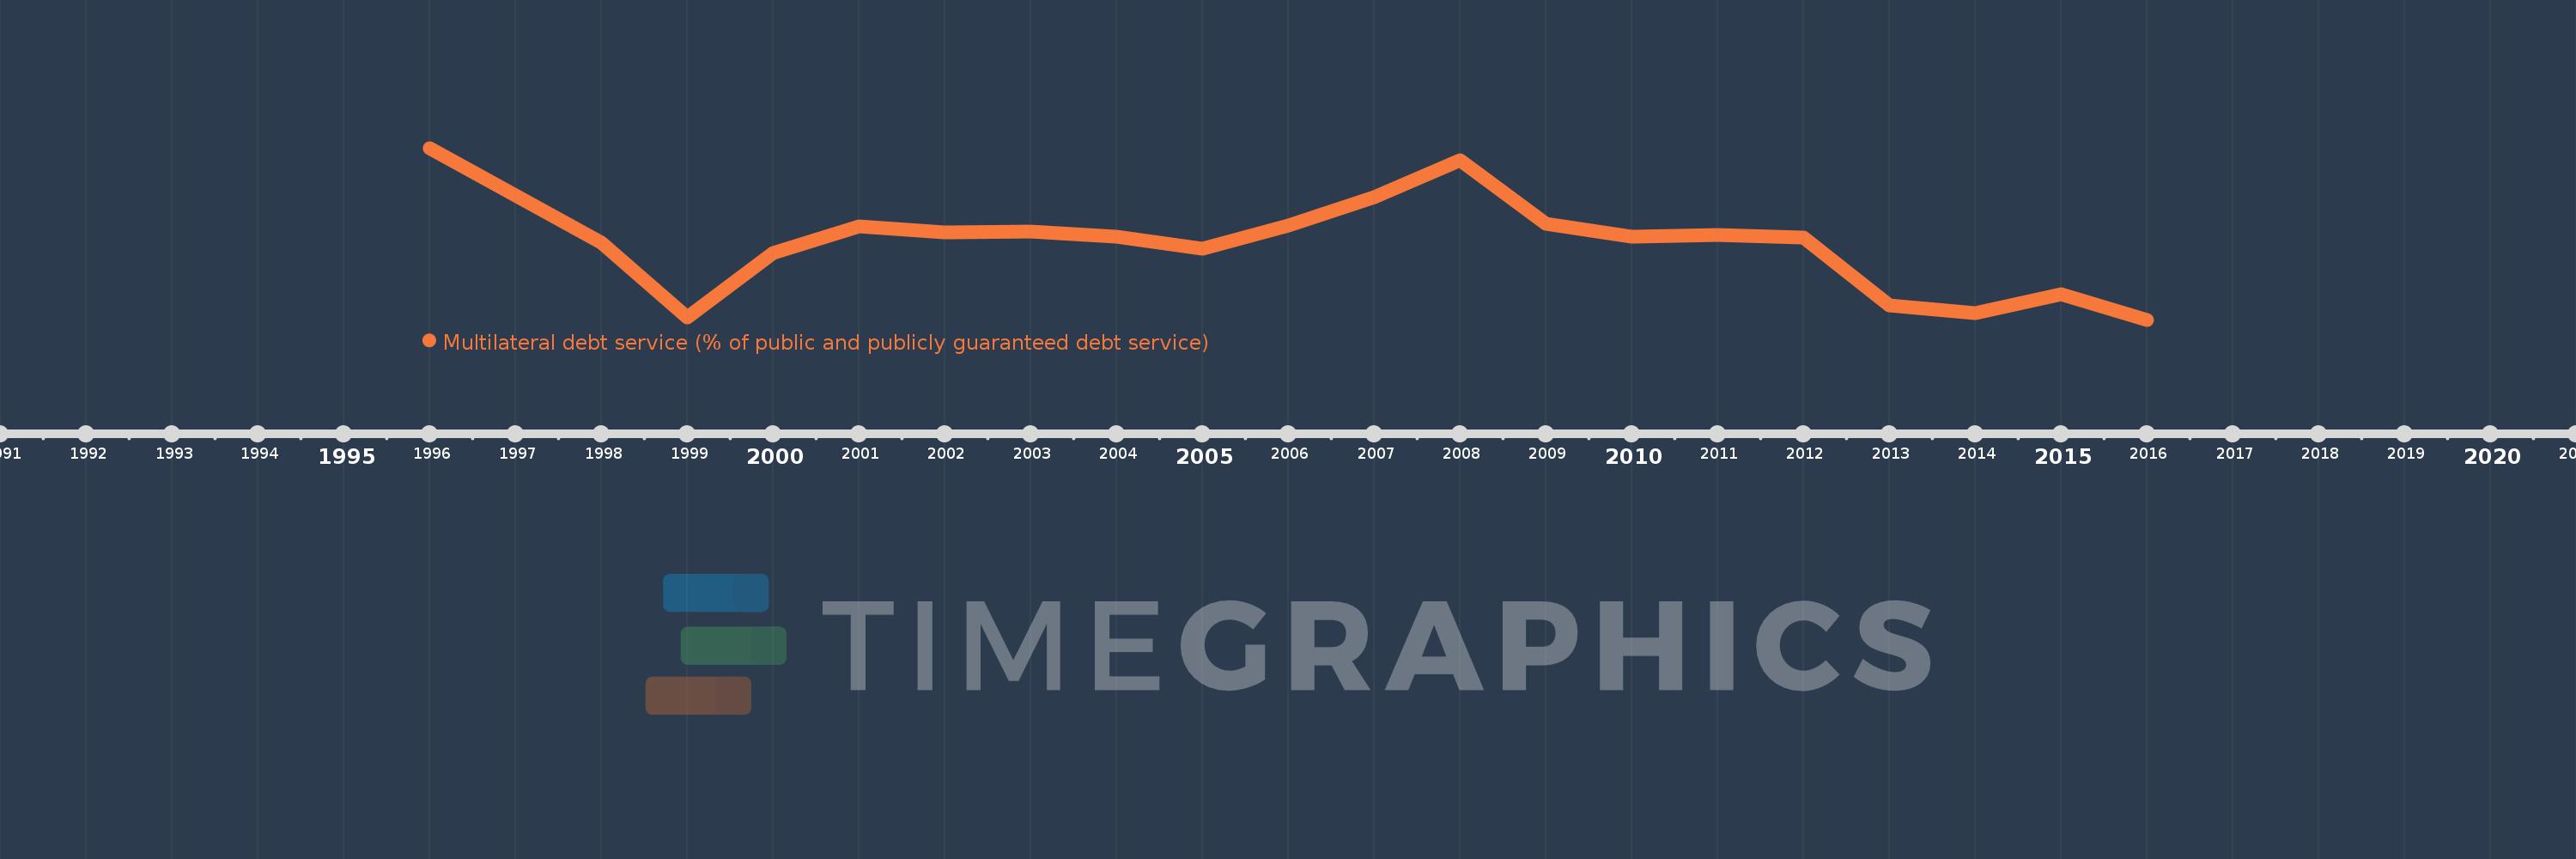
Multilateral debt service (% of public and publicly guaranteed debt service)
2016,2015,2014,2013,2012,2011,2010,2009,2008,2007,2006,2005,2004,2003,2002,2001,2000,1999,1998,1996
This statistics in other country:
Timeline:
This timeline shows a graph from 1996 to 2016 of Eritrea. No data until 1995. Number of actual observations by date: 20.
Source name:
World Development Indicators
Source organization:
World Bank, International Debt Statistics.
Categories, topics:
External Debt
Last updated:
apr 23, 2017
Indicators value changes by year
Minimum:
14.802
jan 1, 2016
At the date of observation
Value
Absolute change
Change from previous value
jan 1, 1996
100.0
+100.0
0.0%
jan 1, 1998
53.069
-46.931
-46.93%
jan 1, 1999
16.164
-36.905
-69.54%
jan 1, 2000
47.733
+31.568
195.29%
jan 1, 2001
61.104
+13.371
28.01%
jan 1, 2002
57.995
-3.108
-5.09%
jan 1, 2003
58.653
+0.657
1.13%
jan 1, 2004
55.79
-2.862
-4.88%
jan 1, 2005
50.074
-5.716
-10.25%
jan 1, 2006
61.578
+11.504
22.97%
jan 1, 2007
75.561
+13.983
22.71%
jan 1, 2008
93.818
+18.257
24.16%
jan 1, 2009
62.566
-31.252
-33.31%
jan 1, 2010
56.071
-6.495
-10.38%
jan 1, 2011
56.928
+0.857
1.53%
jan 1, 2012
55.727
-1.201
-2.11%
jan 1, 2013
21.77
-33.956
-60.93%
jan 1, 2014
18.252
-3.518
-16.16%
jan 1, 2015
27.301
+9.049
49.58%
jan 1, 2016
14.802
-12.499
-45.78%
Ranking of countries by current statistics by years


Comments: