29
/
en
AIzaSyAYiBZKx7MnpbEhh9jyipgxe19OcubqV5w
April 1, 2024
251056
St. Lucia
LCA
true
2
1
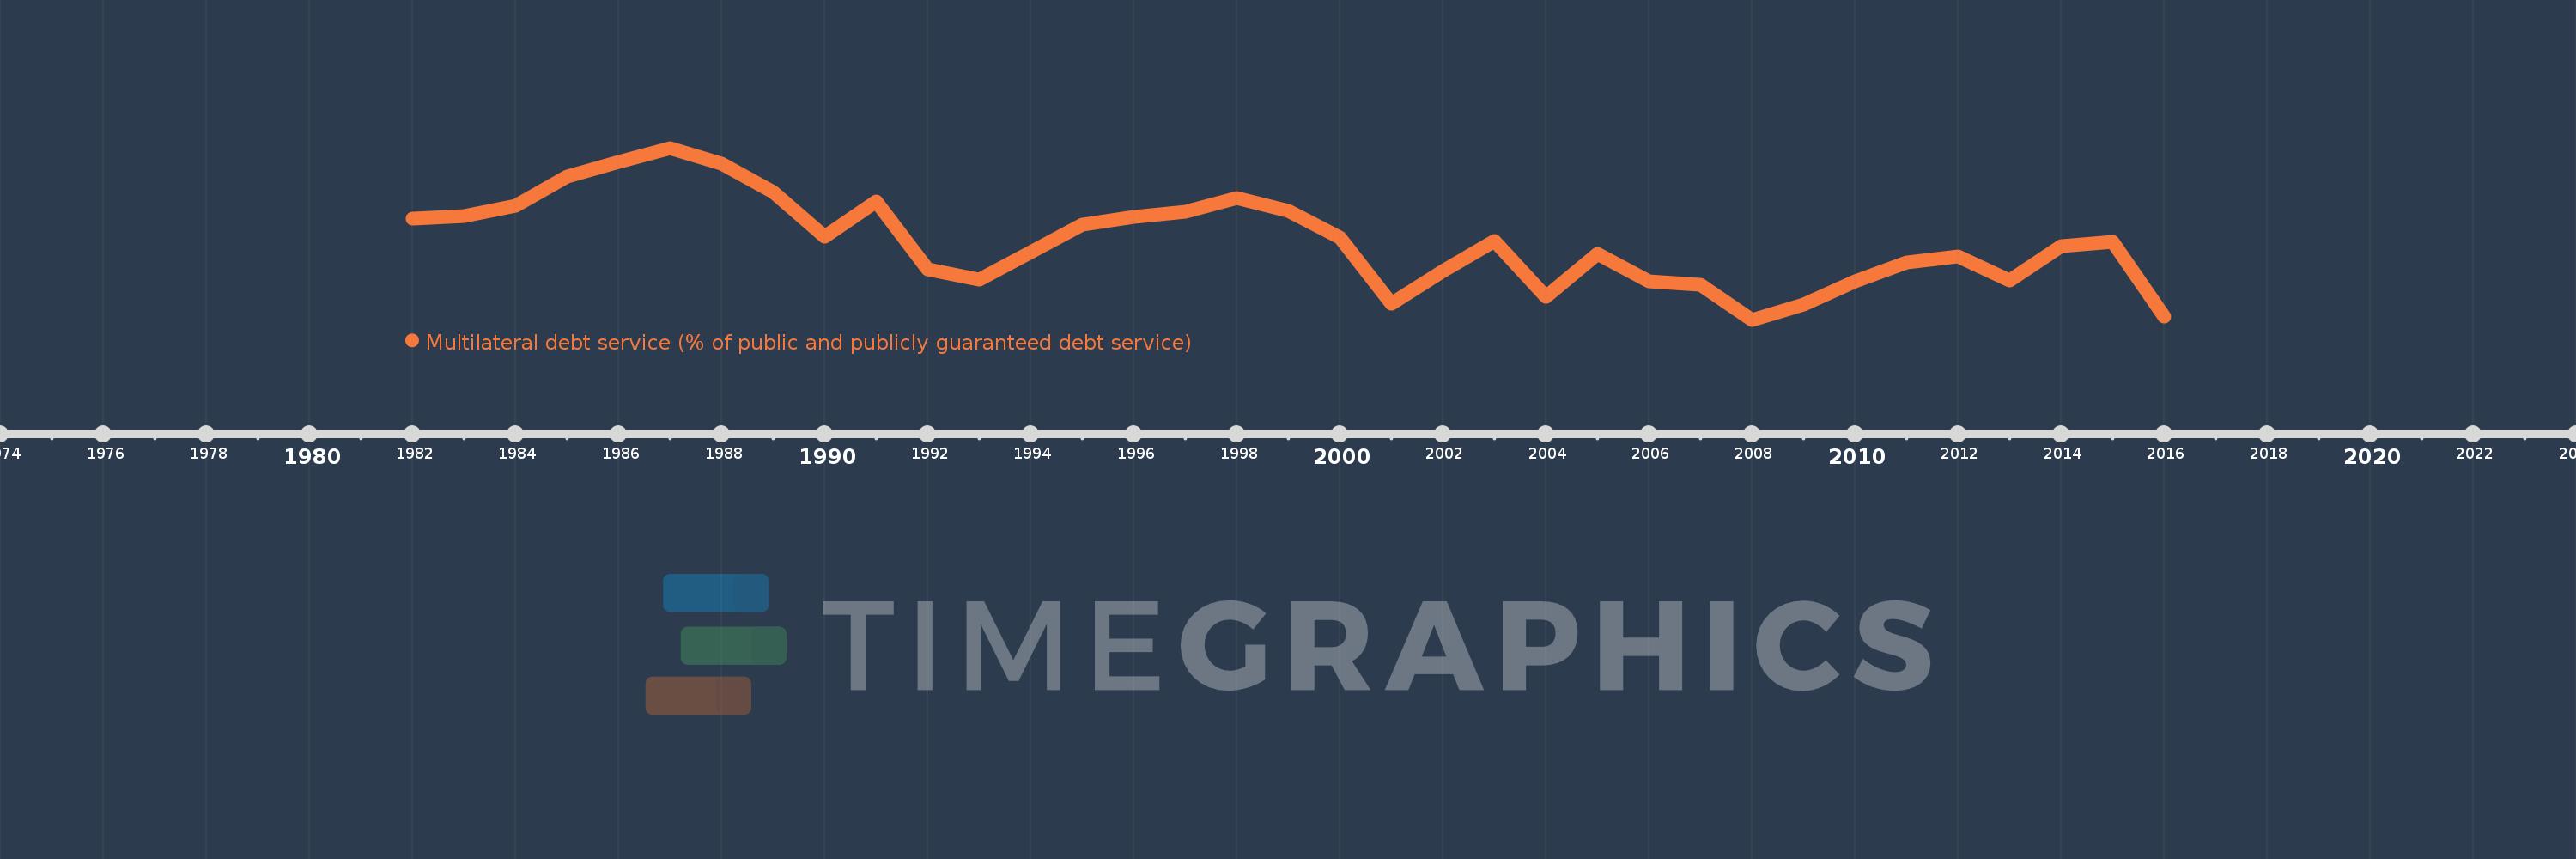
Multilateral debt service (% of public and publicly guaranteed debt service)
2016,2015,2014,2013,2012,2011,2010,2009,2008,2007,2006,2005,2004,2003,2002,2001,2000,1999,1998,1997,1996,1995,1994,1993,1992,1991,1990,1989,1988,1987,1986,1985,1984,1983,1982
This statistics in other country:
Timeline:
This timeline shows a graph from 1982 to 2016 of St. Lucia. No data until 1981. Number of actual observations by date: 35.
Source name:
World Development Indicators
Source organization:
World Bank, International Debt Statistics.
Categories, topics:
External Debt
Last updated:
apr 23, 2017
Indicators value changes by year
Minimum:
34.357
jan 1, 2008
Maximum:
85.692
jan 1, 1987
At the date of observation
Value
Absolute change
Change from previous value
jan 1, 1982
64.486
+64.486
0.0%
jan 1, 1983
65.441
+0.955
1.48%
jan 1, 1984
68.295
+2.853
4.36%
jan 1, 1985
77.09
+8.796
12.88%
jan 1, 1986
81.395
+4.305
5.58%
jan 1, 1987
85.692
+4.296
5.28%
jan 1, 1988
80.887
-4.804
-5.61%
jan 1, 1989
72.6
-8.288
-10.25%
jan 1, 1990
59.305
-13.295
-18.31%
jan 1, 1991
69.646
+10.341
17.44%
jan 1, 1992
49.498
-20.148
-28.93%
jan 1, 1993
46.383
-3.115
-6.29%
jan 1, 1994
54.627
+8.244
17.77%
jan 1, 1995
62.812
+8.185
14.98%
jan 1, 1996
65.01
+2.198
3.5%
jan 1, 1997
66.692
+1.682
2.59%
jan 1, 1998
70.812
+4.12
6.18%
jan 1, 1999
66.777
-4.035
-5.7%
jan 1, 2000
58.958
-7.818
-11.71%
jan 1, 2001
39.078
-19.88
-33.72%
jan 1, 2002
48.844
+9.766
24.99%
jan 1, 2003
57.874
+9.029
18.49%
jan 1, 2004
41.194
-16.68
-28.82%
jan 1, 2005
54.032
+12.838
31.17%
jan 1, 2006
45.915
-8.117
-15.02%
jan 1, 2007
44.914
-1.001
-2.18%
jan 1, 2008
34.357
-10.557
-23.5%
jan 1, 2009
38.942
+4.584
13.34%
jan 1, 2010
45.945
+7.003
17.98%
jan 1, 2011
51.36
+5.415
11.79%
jan 1, 2012
53.381
+2.021
3.94%
jan 1, 2013
46.049
-7.332
-13.74%
jan 1, 2014
56.481
+10.432
22.66%
jan 1, 2015
57.683
+1.202
2.13%
jan 1, 2016
35.403
-22.281
-38.63%
Ranking of countries by current statistics by years


Comments: