29
/
en
AIzaSyAYiBZKx7MnpbEhh9jyipgxe19OcubqV5w
April 1, 2024
31447
Europe & Central Asia (excluding high income)
ECA
false
2
1
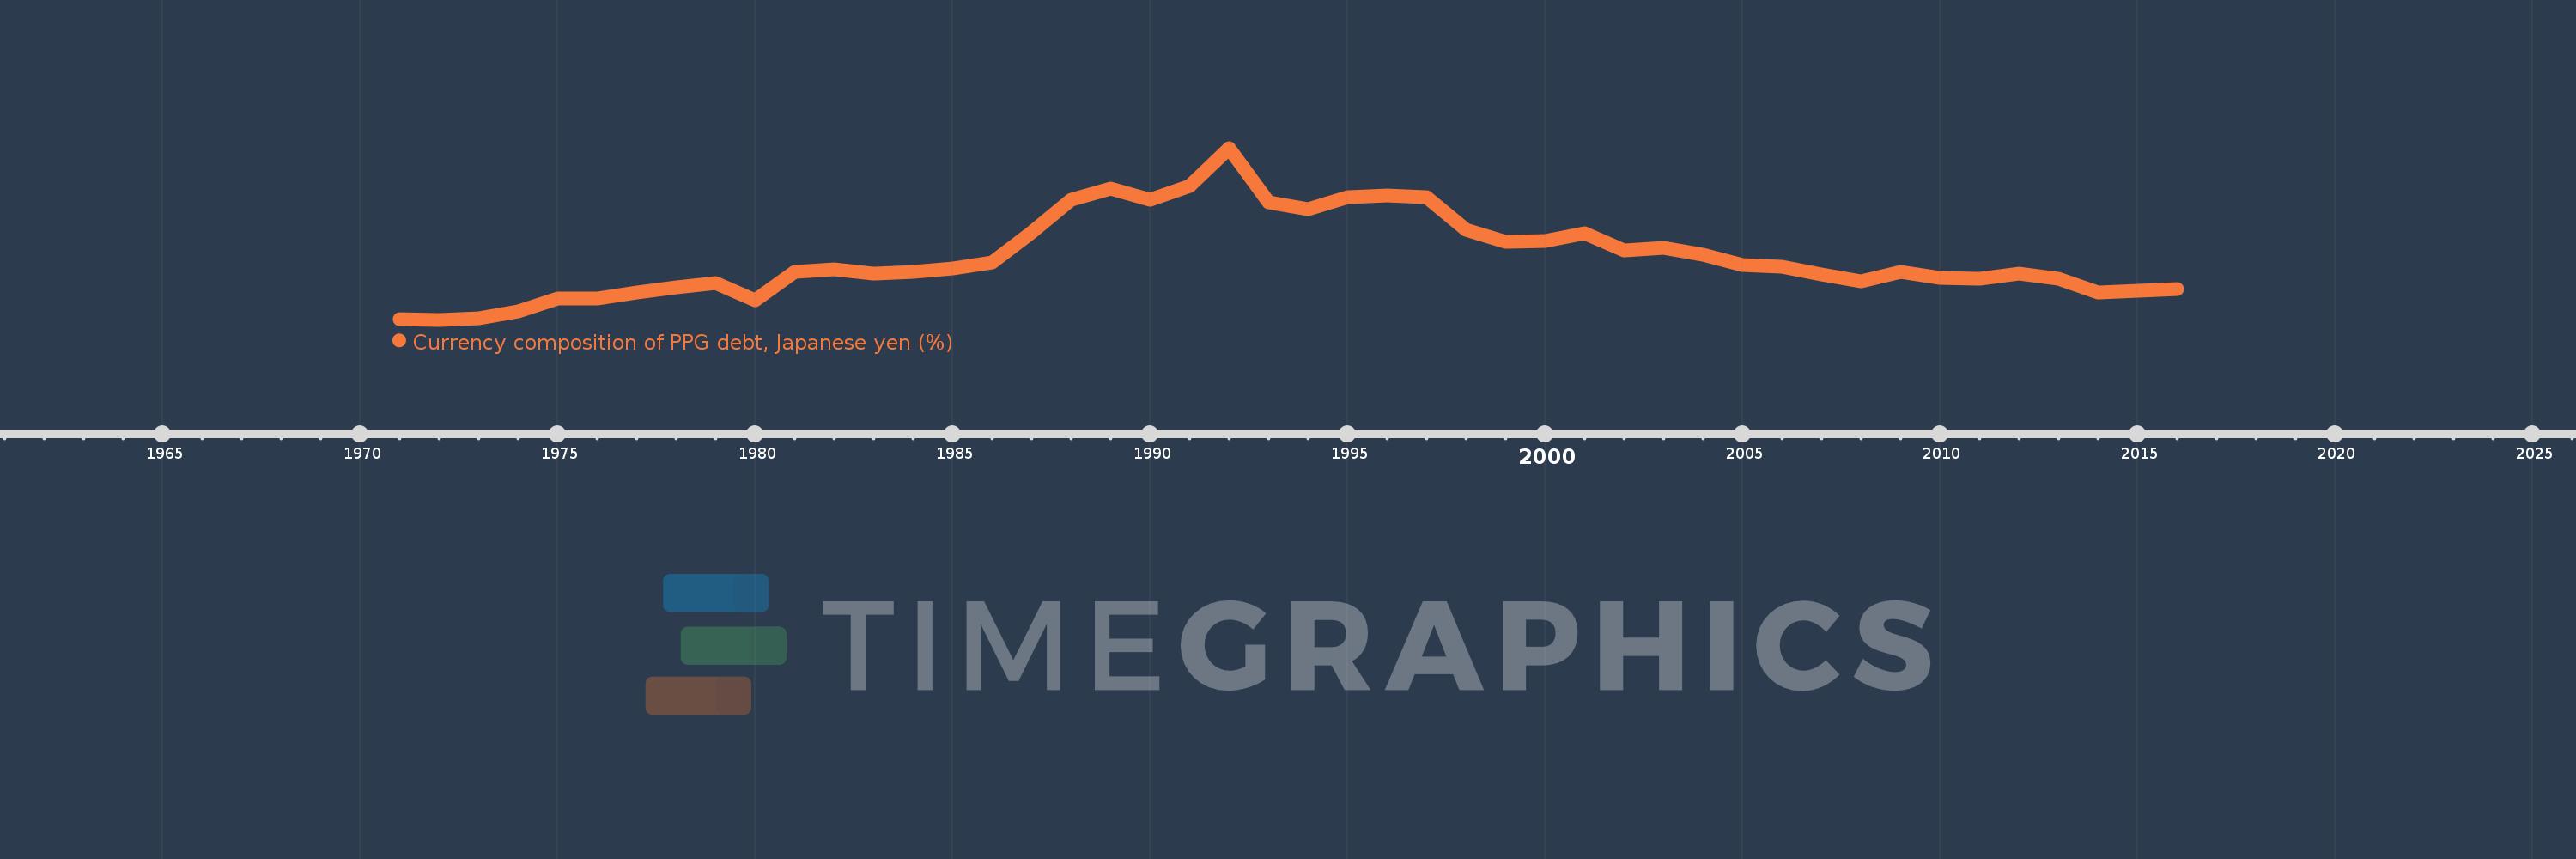
Currency composition of PPG debt, Japanese yen (%)
2016,2015,2014,2013,2012,2011,2010,2009,2008,2007,2006,2005,2004,2003,2002,2001,2000,1999,1998,1997,1996,1995,1994,1993,1992,1991,1990,1989,1988,1987,1986,1985,1984,1983,1982,1981,1980,1979,1978,1977,1976,1975,1974,1973,1972,1971
This statistics in other country:
Timeline:
This timeline shows a graph from 1971 to 2016 of Europe & Central Asia (excluding high income). No data until 1970. Number of actual observations by date: 46.
Source name:
World Development Indicators
Source organization:
World Bank, International Debt Statistics.
Categories, topics:
External Debt
Last updated:
apr 23, 2017
Indicators value changes by year
Maximum:
11.362
jan 1, 1992
At the date of observation
Value
Absolute change
Change from previous value
jan 1, 1971
0.112
+0.112
0.0%
jan 1, 1972
0.078
-0.034
-30.52%
jan 1, 1973
0.192
+0.115
148.14%
jan 1, 1974
0.605
+0.413
214.57%
jan 1, 1975
1.495
+0.889
146.97%
jan 1, 1976
1.499
+0.004
0.29%
jan 1, 1977
1.878
+0.379
25.3%
jan 1, 1978
2.193
+0.315
16.76%
jan 1, 1979
2.468
+0.275
12.53%
jan 1, 1980
1.374
-1.094
-44.32%
jan 1, 1981
3.228
+1.854
134.9%
jan 1, 1982
3.365
+0.137
4.24%
jan 1, 1983
3.119
-0.246
-7.31%
jan 1, 1984
3.239
+0.121
3.87%
jan 1, 1985
3.431
+0.191
5.9%
jan 1, 1986
3.863
+0.432
12.6%
jan 1, 1987
5.8
+1.938
50.17%
jan 1, 1988
7.965
+2.164
37.31%
jan 1, 1989
8.676
+0.712
8.94%
jan 1, 1990
7.965
-0.711
-8.2%
jan 1, 1991
8.89
+0.925
11.61%
jan 1, 1992
11.362
+2.472
27.81%
jan 1, 1993
7.765
-3.598
-31.66%
jan 1, 1994
7.357
-0.408
-5.25%
jan 1, 1995
8.144
+0.787
10.7%
jan 1, 1996
8.218
+0.074
0.91%
jan 1, 1997
8.126
-0.092
-1.12%
jan 1, 1998
5.97
-2.156
-26.54%
jan 1, 1999
5.196
-0.773
-12.95%
jan 1, 2000
5.26
+0.064
1.23%
jan 1, 2001
5.755
+0.495
9.41%
jan 1, 2002
4.638
-1.117
-19.41%
jan 1, 2003
4.823
+0.185
3.99%
jan 1, 2004
4.361
-0.462
-9.58%
jan 1, 2005
3.7
-0.661
-15.16%
jan 1, 2006
3.531
-0.169
-4.56%
jan 1, 2007
3.06
-0.471
-13.33%
jan 1, 2008
2.598
-0.462
-15.09%
jan 1, 2009
3.214
+0.616
23.7%
jan 1, 2010
2.823
-0.391
-12.17%
jan 1, 2011
2.757
-0.066
-2.35%
jan 1, 2012
3.101
+0.345
12.5%
jan 1, 2013
2.745
-0.356
-11.47%
jan 1, 2014
1.859
-0.886
-32.29%
jan 1, 2015
2.001
+0.142
7.62%
jan 1, 2016
2.107
+0.106
5.31%
Ranking of countries by current statistics by years


Comments: