29
/
en
AIzaSyAYiBZKx7MnpbEhh9jyipgxe19OcubqV5w
April 1, 2024
70939
Armenia
ARM
true
2
1
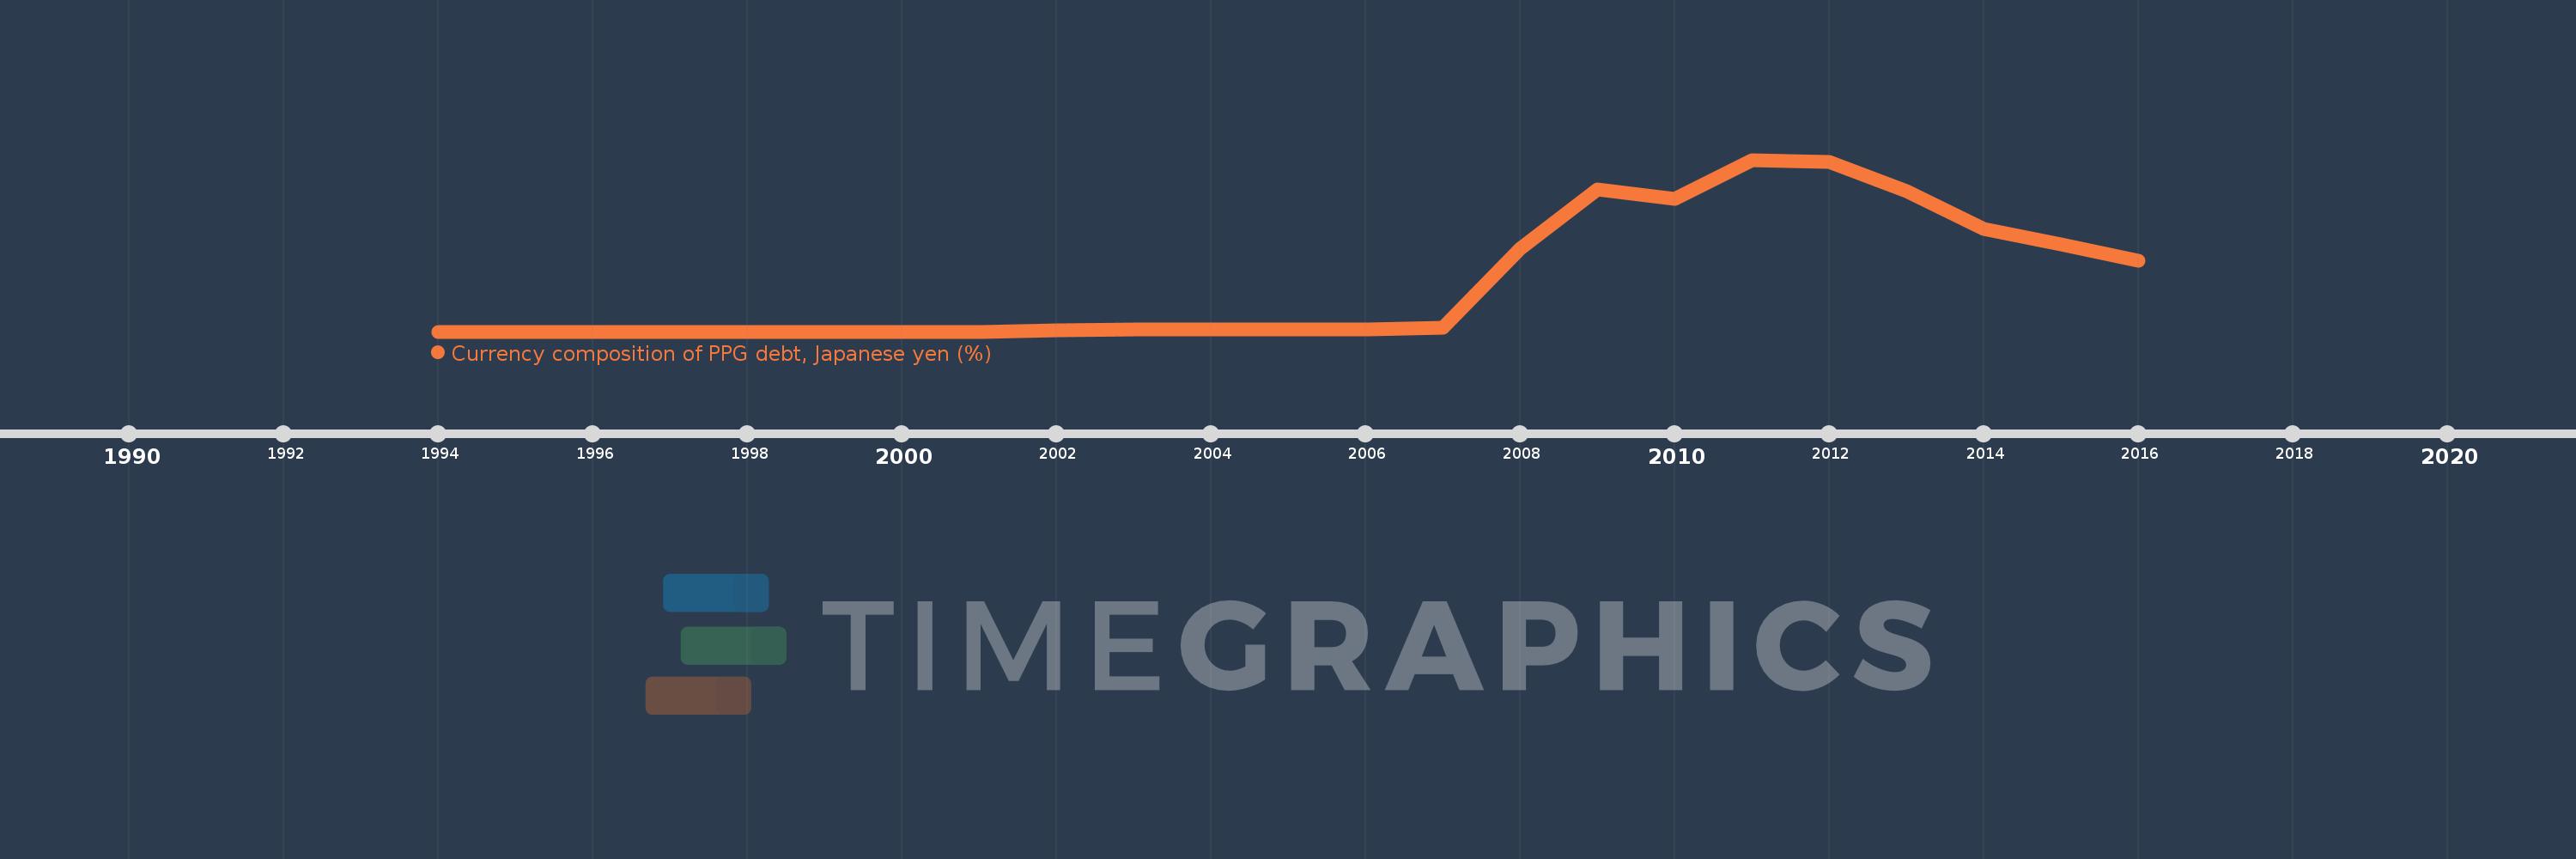
Currency composition of PPG debt, Japanese yen (%)
2016,2015,2014,2013,2012,2011,2010,2009,2008,2007,2006,2005,2004,2003,2002,2001,2000,1999,1998,1997,1996,1995,1994
This statistics in other country:
Timeline:
This timeline shows a graph from 1994 to 2016 of Armenia. No data until 1993. Number of actual observations by date: 23.
Source name:
World Development Indicators
Source organization:
World Bank, International Debt Statistics.
Categories, topics:
External Debt
Last updated:
apr 23, 2017
Indicators value changes by year
Maximum:
14.641
jan 1, 2011
At the date of observation
Value
Absolute change
Change from previous value
jan 1, 2002
0.141
+0.141
%
jan 1, 2003
0.181
+0.041
28.74%
jan 1, 2004
0.189
+0.008
4.41%
jan 1, 2005
0.178
-0.011
-6.02%
jan 1, 2006
0.169
-0.009
-5.0%
jan 1, 2007
0.353
+0.184
108.93%
jan 1, 2008
7.041
+6.688
1.89K%
jan 1, 2009
12.1
+5.059
71.84%
jan 1, 2010
11.344
-0.755
-6.24%
jan 1, 2011
14.641
+3.297
29.06%
jan 1, 2012
14.475
-0.166
-1.13%
jan 1, 2013
11.961
-2.514
-17.37%
jan 1, 2014
8.74
-3.222
-26.93%
jan 1, 2015
7.422
-1.318
-15.08%
jan 1, 2016
6.049
-1.372
-18.49%
Ranking of countries by current statistics by years


Comments: