29
/
en
AIzaSyAYiBZKx7MnpbEhh9jyipgxe19OcubqV5w
April 1, 2024
165958
Kazakhstan
KAZ
true
2
1
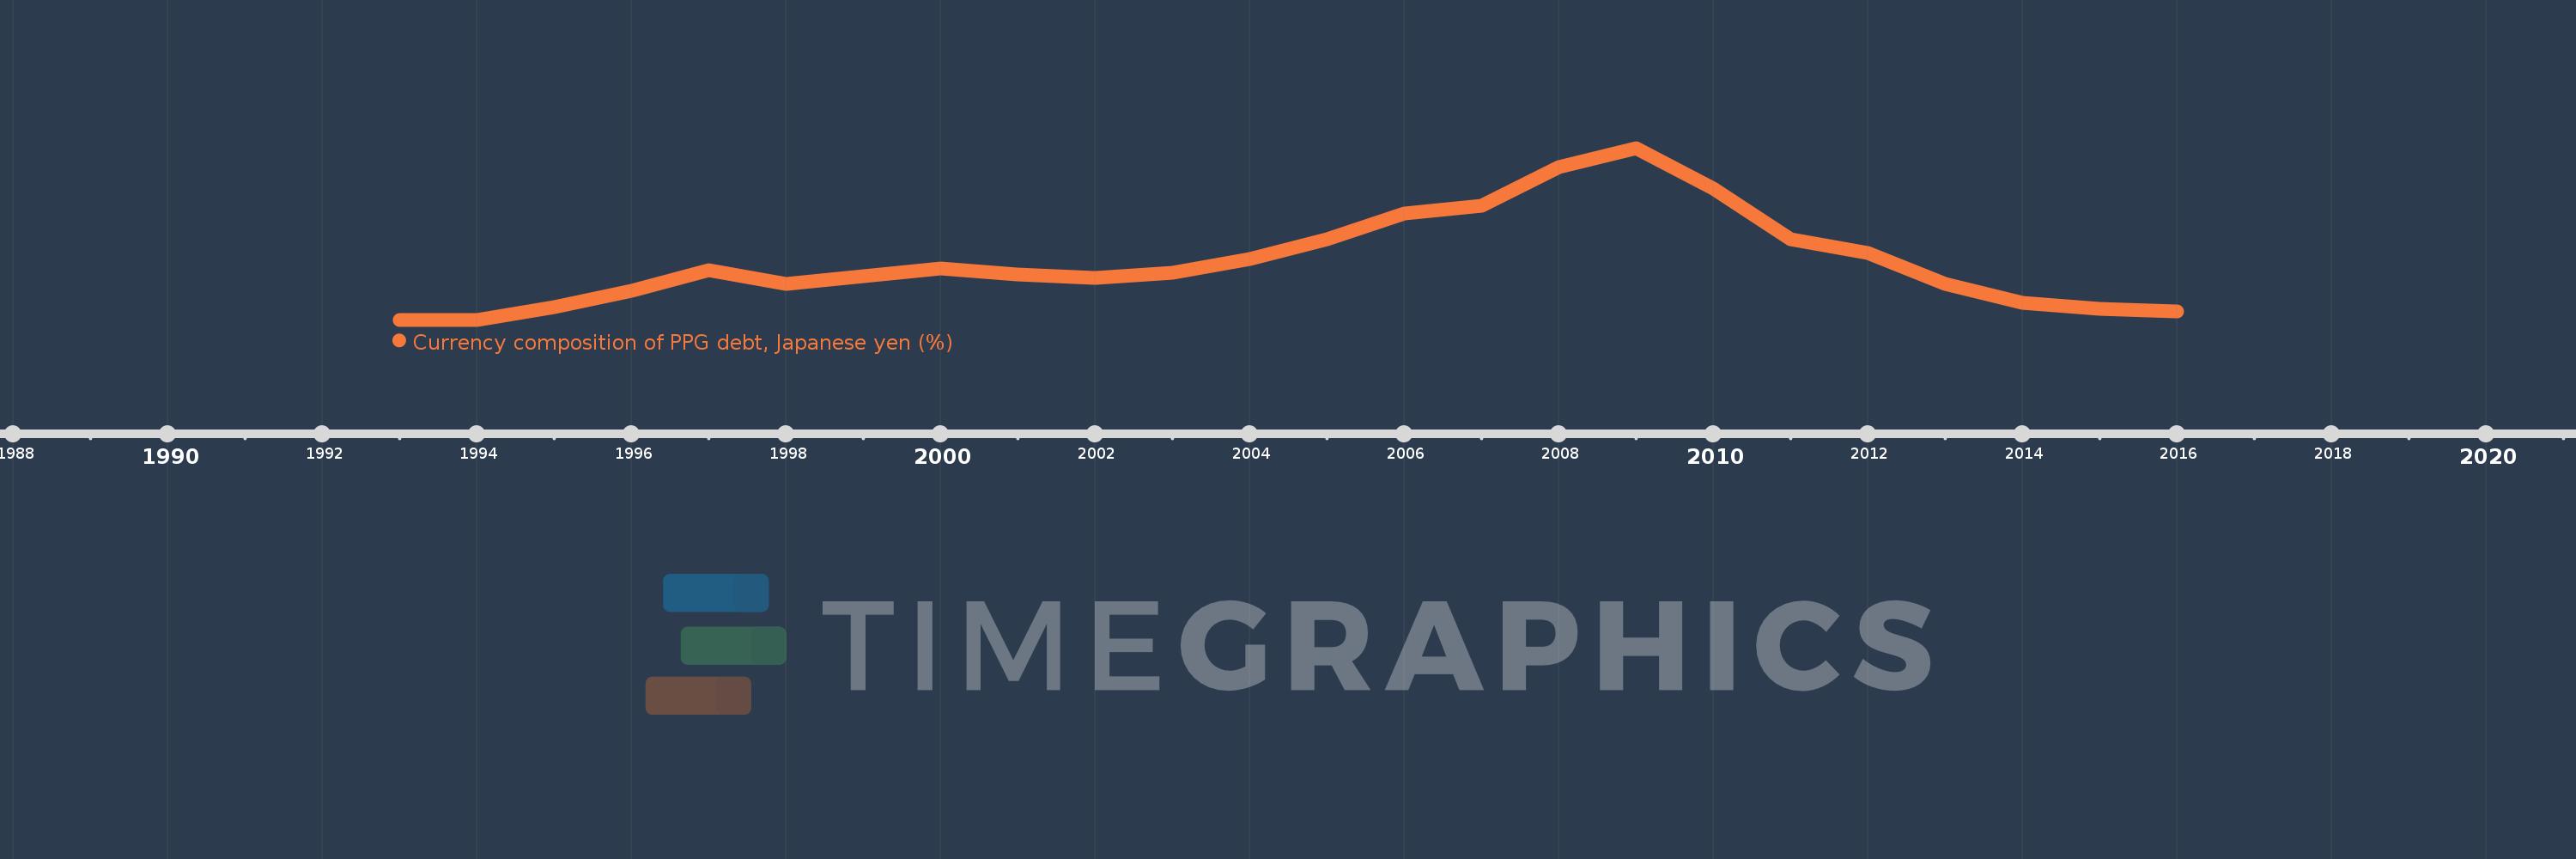
Currency composition of PPG debt, Japanese yen (%)
2016,2015,2014,2013,2012,2011,2010,2009,2008,2007,2006,2005,2004,2003,2002,2001,2000,1999,1998,1997,1996,1995,1994,1993
This statistics in other country:
Timeline:
This timeline shows a graph from 1993 to 2016 of Kazakhstan. No data until 1992. Number of actual observations by date: 24.
Source name:
World Development Indicators
Source organization:
World Bank, International Debt Statistics.
Categories, topics:
External Debt
Last updated:
apr 23, 2017
Indicators value changes by year
Maximum:
52.534
jan 1, 2009
At the date of observation
Value
Absolute change
Change from previous value
jan 1, 1995
3.896
+3.896
%
jan 1, 1996
8.913
+5.018
128.81%
jan 1, 1997
15.085
+6.172
69.24%
jan 1, 1998
11.08
-4.005
-26.55%
jan 1, 1999
13.202
+2.122
19.15%
jan 1, 2000
15.679
+2.478
18.77%
jan 1, 2001
13.816
-1.863
-11.88%
jan 1, 2002
12.813
-1.004
-7.26%
jan 1, 2003
14.312
+1.499
11.7%
jan 1, 2004
18.564
+4.252
29.71%
jan 1, 2005
24.579
+6.014
32.4%
jan 1, 2006
32.597
+8.018
32.62%
jan 1, 2007
34.904
+2.307
7.08%
jan 1, 2008
46.73
+11.826
33.88%
jan 1, 2009
52.534
+5.804
12.42%
jan 1, 2010
40.125
-12.409
-23.62%
jan 1, 2011
24.559
-15.566
-38.79%
jan 1, 2012
20.405
-4.154
-16.91%
jan 1, 2013
11.066
-9.339
-45.77%
jan 1, 2014
5.176
-5.89
-53.22%
jan 1, 2015
3.448
-1.728
-33.39%
jan 1, 2016
2.419
-1.029
-29.85%
Ranking of countries by current statistics by years


Comments: