29
/
en
AIzaSyAYiBZKx7MnpbEhh9jyipgxe19OcubqV5w
April 1, 2024
110766
Congo, Rep.
COG
true
2
1
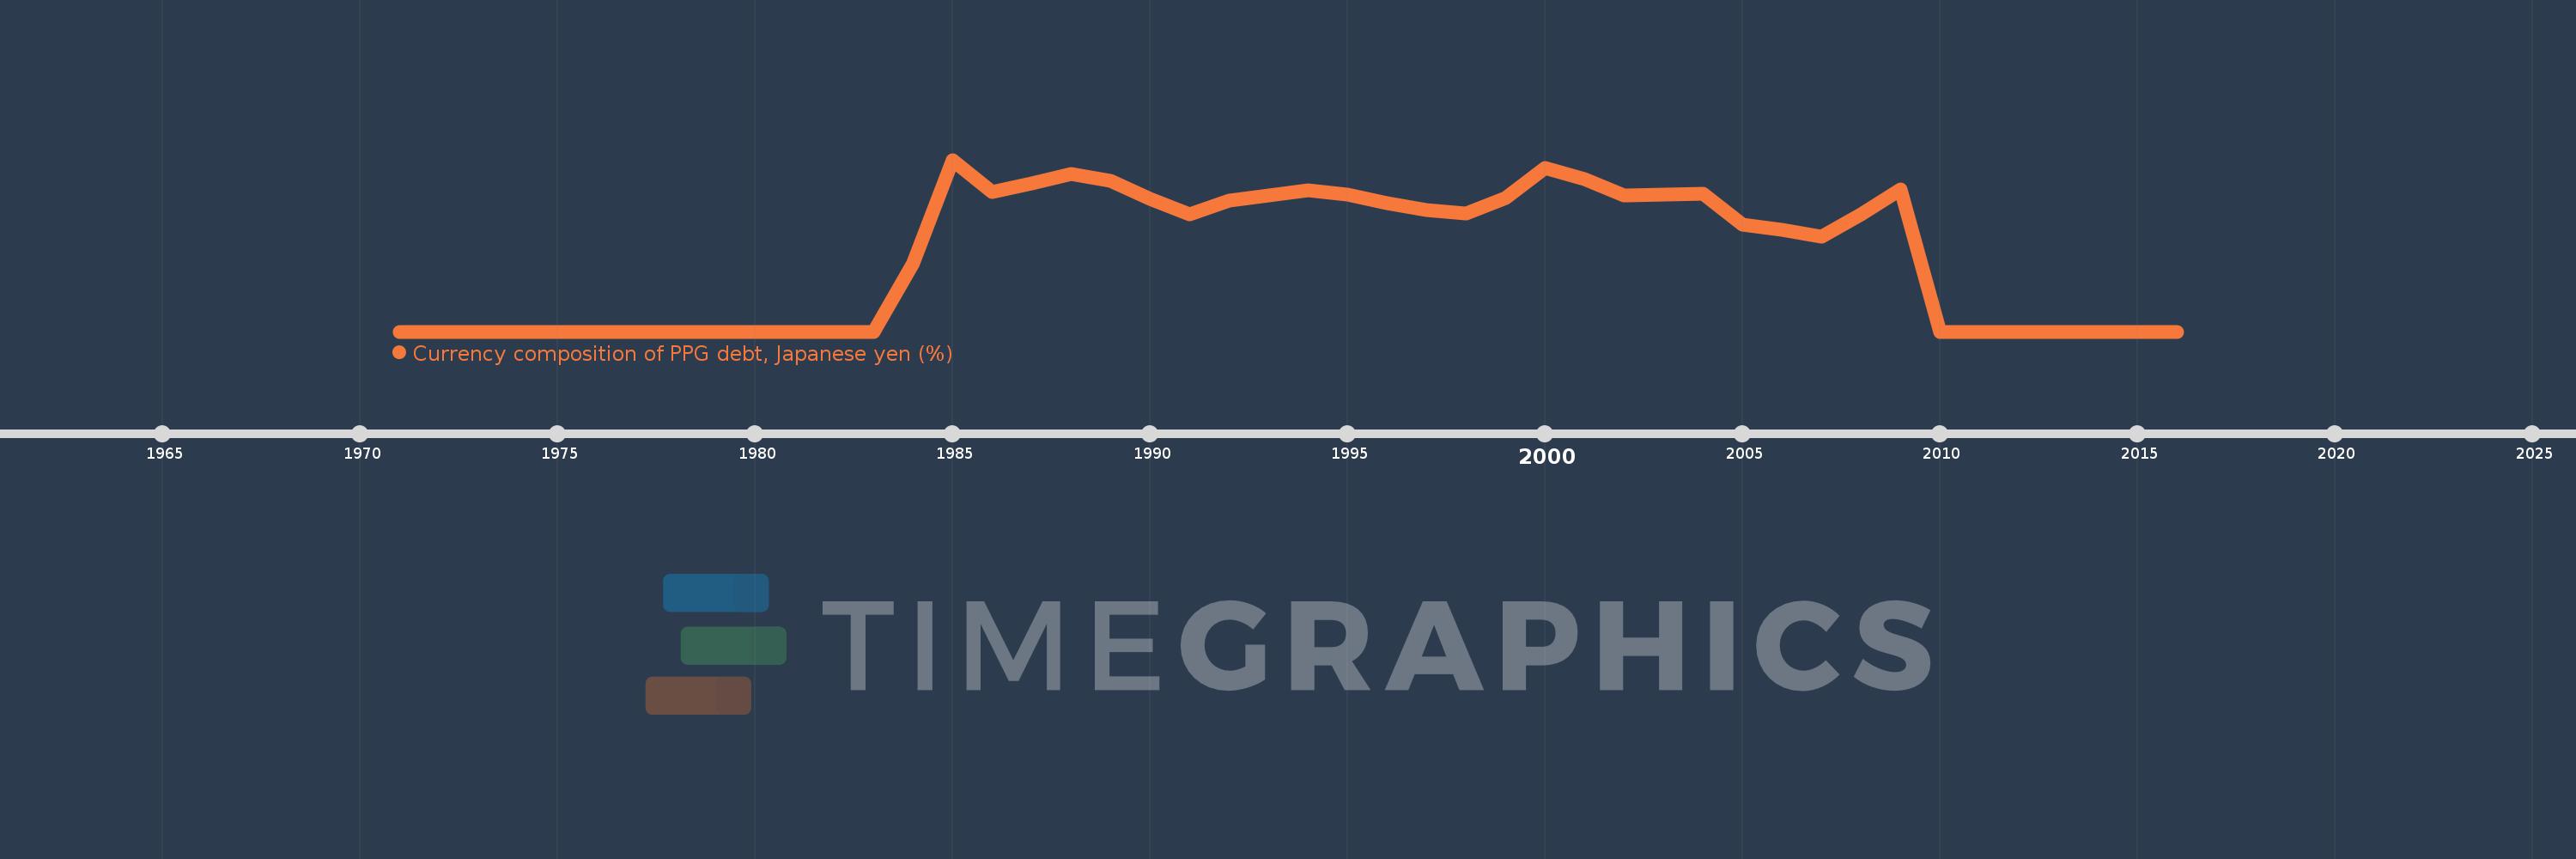
Currency composition of PPG debt, Japanese yen (%)
2016,2015,2014,2013,2012,2011,2010,2009,2008,2007,2006,2005,2004,2003,2002,2001,2000,1999,1998,1997,1996,1995,1994,1993,1992,1991,1990,1989,1988,1987,1986,1985,1984,1983,1982,1981,1980,1979,1978,1977,1976,1975,1974,1973,1972,1971
This statistics in other country:
Timeline:
This timeline shows a graph from 1971 to 2016 of Congo, Rep.. No data until 1970. Number of actual observations by date: 46.
Source name:
World Development Indicators
Source organization:
World Bank, International Debt Statistics.
Categories, topics:
External Debt
Last updated:
apr 23, 2017
Indicators value changes by year
At the date of observation
Value
Absolute change
Change from previous value
jan 1, 1984
0.099
+0.099
%
jan 1, 1985
0.248
+0.149
150.2%
jan 1, 1986
0.201
-0.048
-19.14%
jan 1, 1987
0.214
+0.013
6.53%
jan 1, 1988
0.228
+0.014
6.5%
jan 1, 1989
0.218
-0.01
-4.35%
jan 1, 1990
0.191
-0.027
-12.53%
jan 1, 1991
0.169
-0.022
-11.5%
jan 1, 1992
0.189
+0.02
11.86%
jan 1, 1993
0.197
+0.009
4.56%
jan 1, 1994
0.204
+0.007
3.55%
jan 1, 1995
0.198
-0.006
-3.09%
jan 1, 1996
0.185
-0.013
-6.72%
jan 1, 1997
0.175
-0.01
-5.36%
jan 1, 1998
0.171
-0.004
-2.4%
jan 1, 1999
0.193
+0.022
13.2%
jan 1, 2000
0.236
+0.043
22.28%
jan 1, 2001
0.22
-0.016
-6.95%
jan 1, 2002
0.197
-0.023
-10.43%
jan 1, 2003
0.198
+0.001
0.46%
jan 1, 2004
0.199
+0.001
0.51%
jan 1, 2005
0.155
-0.043
-21.7%
jan 1, 2006
0.147
-0.009
-5.66%
jan 1, 2007
0.137
-0.01
-6.82%
jan 1, 2008
0.169
+0.033
23.92%
jan 1, 2009
0.205
+0.036
21.31%
jan 1, 2010
0.0
-0.205
-100.0%
Ranking of countries by current statistics by years


Comments: