30
/
AIzaSyAYiBZKx7MnpbEhh9jyipgxe19OcubqV5w
April 1, 2024
31145
Europe & Central Asia
ECS
false
2
1
Share of youth not in education, employment, or training, total (% of youth population)
2015,2014,2013,2012,2011,2010,2009,2008,2006
Public Timelines
FAQ
Menu
Public Timelines
FAQ
Public Timelines
FAQ
For education
For educational institutions
For teachers
For students
Open cabinet
For educational institutions
For teachers
For students
Open cabinet
Create
Close
Create a timeline
Public timelines
Library
FAQ
Download
Global statistics library
→
Europe & Central Asia
→
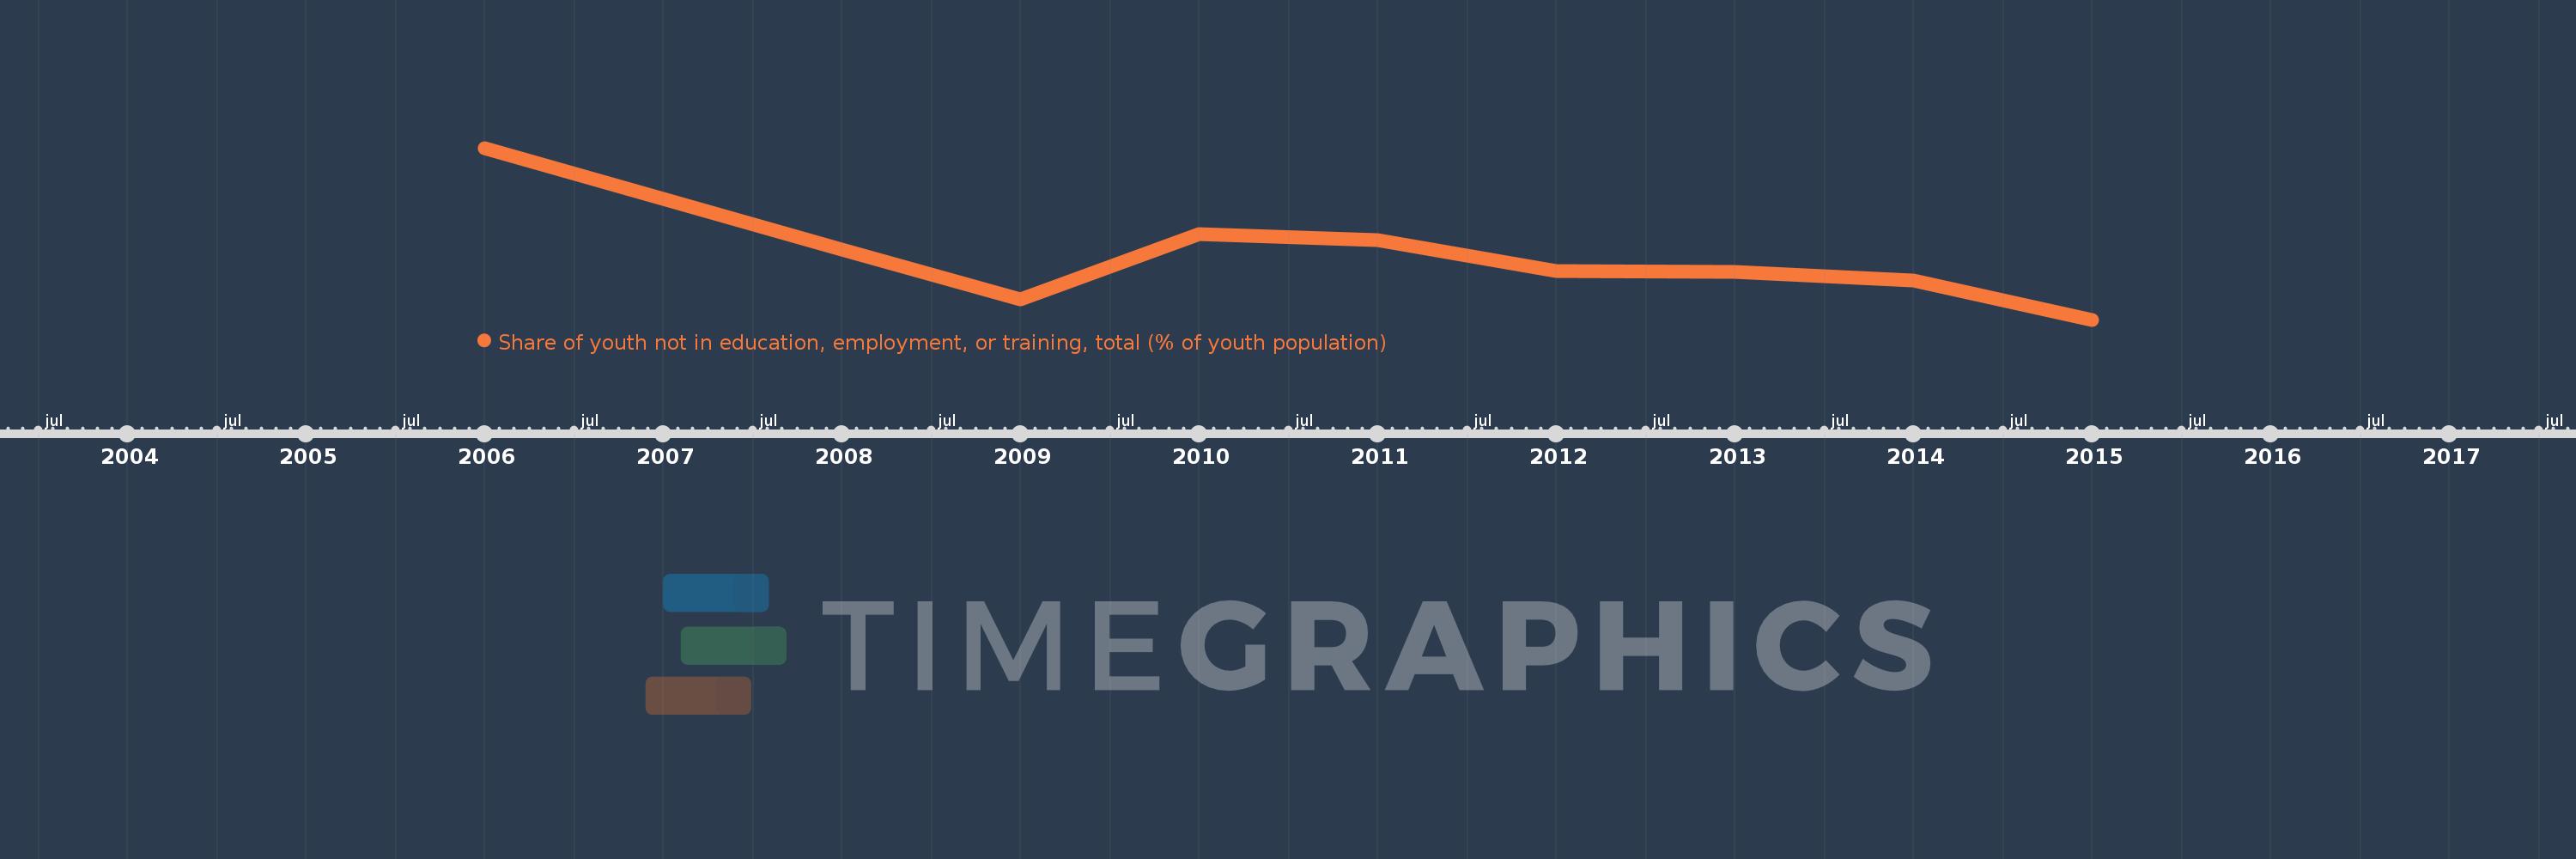
Share of youth not in education, employment, or training, total (% of youth population)
This statistics in other country:
Albania
Algeria
Argentina
Armenia
Aruba
Australia
Austria
Azerbaijan
Bangladesh
Belarus
Belgium
Belize
Benin
Bermuda
Bolivia
Brazil
Bulgaria
Cambodia
Cameroon
Canada
Central Europe and the Baltics
Chile
Colombia
Costa Rica
Croatia
Cyprus
Czech Republic
Denmark
Dominican Republic
Early-demographic dividend
Ecuador
Egypt, Arab Rep.
El Salvador
Estonia
Ethiopia
Euro area
Europe & Central Asia
Europe & Central Asia (excluding high income)
Europe & Central Asia (IDA & IBRD countries)
European Union
Finland
France
Germany
Greece
Guatemala
High income
Honduras
Hong Kong SAR, China
Hungary
Iceland
India
Indonesia
Iran, Islamic Rep.
Ireland
Israel
Italy
Jamaica
Japan
Jordan
Korea, Rep.
Kyrgyz Republic
Latin America & Caribbean
Latin America & Caribbean (excluding high income)
Latin America & the Caribbean (IDA & IBRD countries)
Latvia
Liberia
Lithuania
Luxembourg
Macao SAR, China
Macedonia, FYR
Madagascar
Malawi
Malaysia
Maldives
Mali
Malta
Mexico
Moldova
Mongolia
Mozambique
Namibia
Nepal
Netherlands
New Zealand
Nicaragua
North America
Norway
OECD members
Panama
Paraguay
Peru
Philippines
Poland
Portugal
Post-demographic dividend
Qatar
Romania
Russian Federation
Rwanda
Samoa
Saudi Arabia
Serbia
Seychelles
Singapore
Slovak Republic
Slovenia
South Africa
South Asia
South Asia (IDA & IBRD)
South Sudan
Spain
Sri Lanka
Sudan
Sweden
Switzerland
Tajikistan
Tanzania
Thailand
Togo
Trinidad and Tobago
Tunisia
Turkey
Uganda
Ukraine
United Kingdom
United States
Uruguay
Venezuela, RB
Vietnam
West Bank and Gaza
Yemen, Rep.
Zambia
Timeline:
This timeline shows a graph from
2006
to
2015
of Europe & Central Asia. No data until
2005
. Number of actual observations by date:
9
.
Source name:
World Development Indicators
Source organization:
International Labour Organization, Key Indicators of the Labour Market database.
Categories, topics:
Social Protection & Labor
Last updated:
apr 23, 2017
Indicators value changes by year
Meaning:
15.78
Minimum:
14.834
jan 1, 2015
Maximum:
17.428
jan 1, 2006
At the date of observation
Value
Absolute change
Change from the previous value
jan 1, 2006
17.428
+17.428
0.0%
jan 1, 2008
15.899
-1.529
-8.77%
jan 1, 2009
15.139
-0.76
-4.78%
jan 1, 2010
16.128
+0.989
6.53%
jan 1, 2011
16.042
-0.086
-0.53%
jan 1, 2012
15.565
-0.476
-2.97%
jan 1, 2013
15.554
-0.011
-0.07%
jan 1, 2014
15.431
-0.124
-0.8%
jan 1, 2015
14.834
-0.597
-3.87%
Ranking of countries by current statistics by years
About & Feedback
Terms
Privacy
Library
2024
©
Time.Graphics
Support 24/7
Cabinet
Get premium
Donate
The service accepts bank transfer (ACH, Wire) or cards (Visa, MasterCard, etc). Processed by Stripe.
Secured with SSL
Excellent (Trustpilot Reviews)
Based on 115+ reviews
Write your own review on
Trustpilot.com
