29
/
en
AIzaSyAYiBZKx7MnpbEhh9jyipgxe19OcubqV5w
April 1, 2024
53057
OECD members
OED
false
2
1
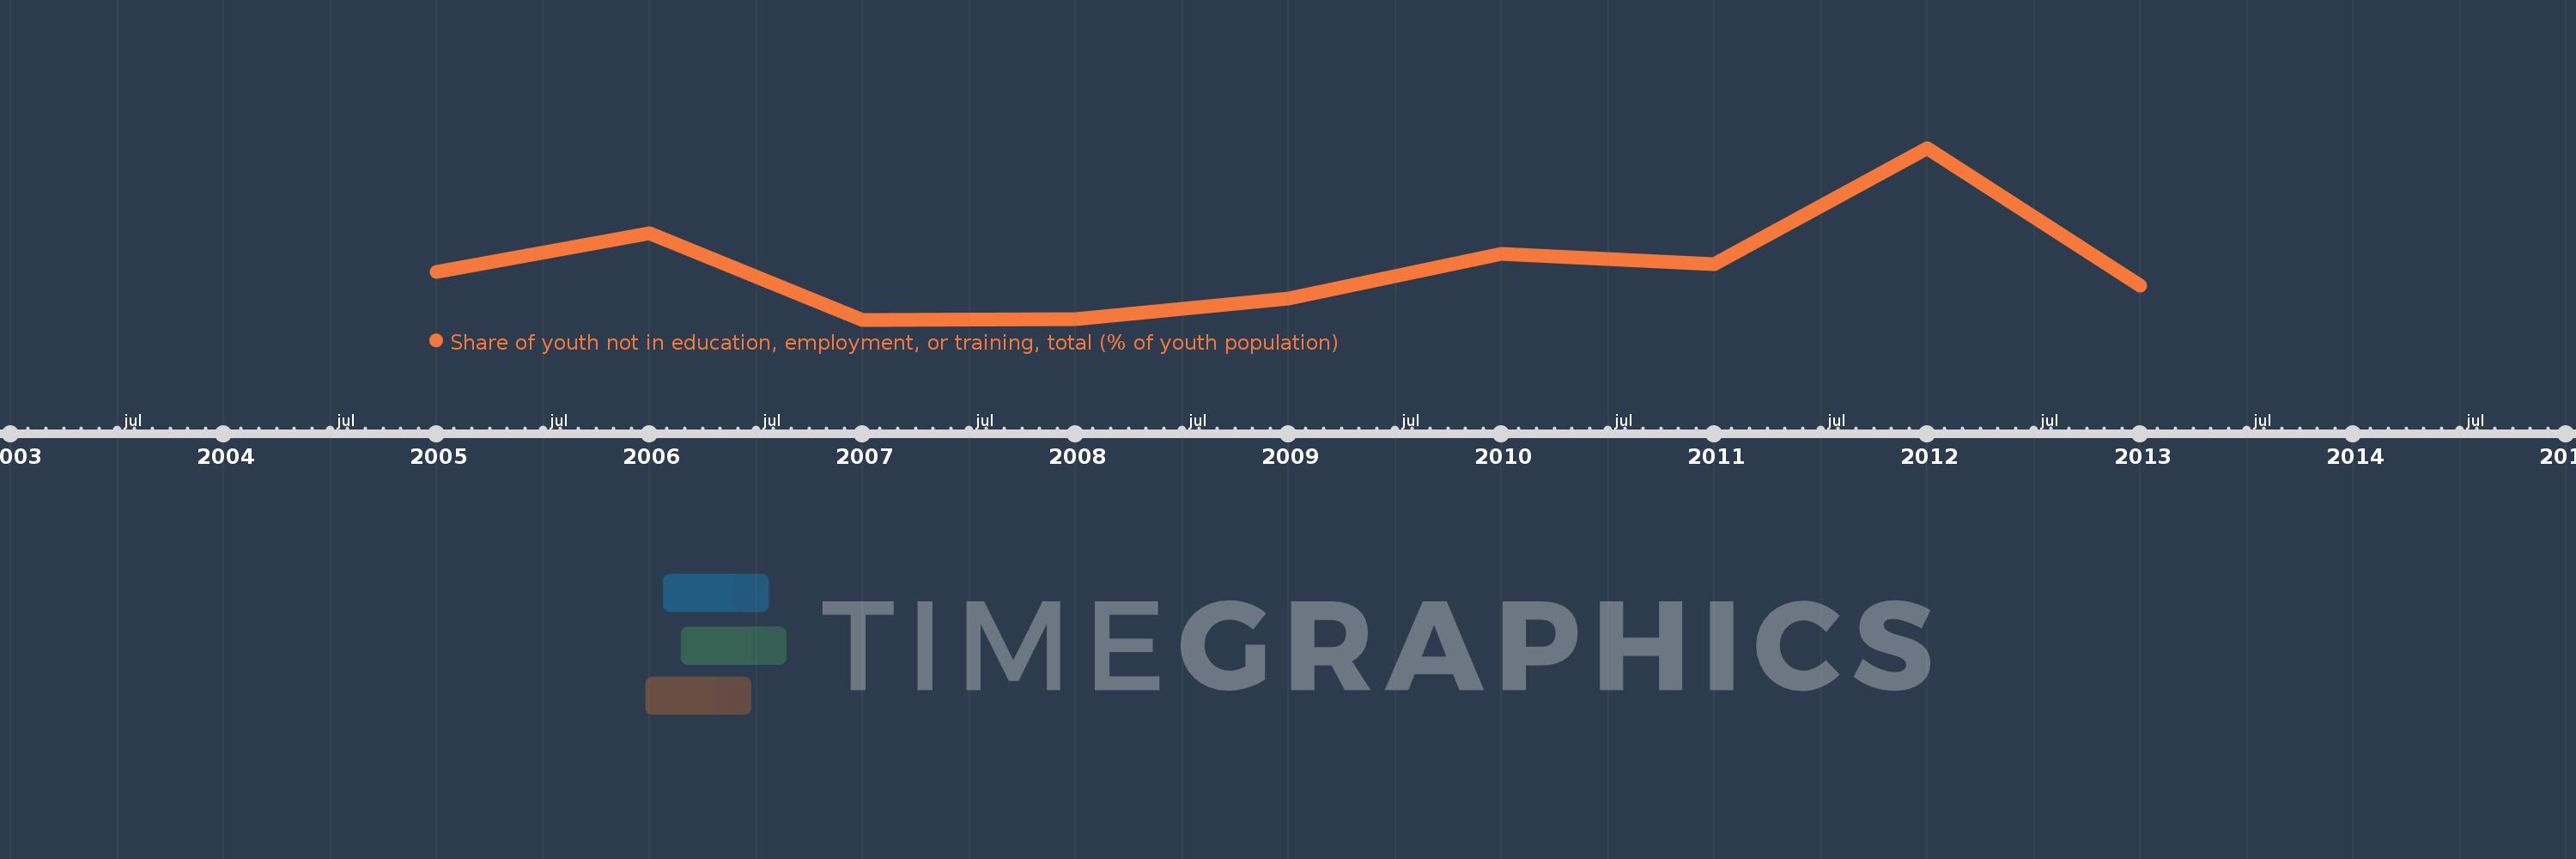
Share of youth not in education, employment, or training, total (% of youth population)
2013,2012,2011,2010,2009,2008,2007,2006,2005
This statistics in other country:
Timeline:
This timeline shows a graph from 2005 to 2013 of OECD members. No data until 2004. Number of actual observations by date: 9.
Source name:
World Development Indicators
Source organization:
International Labour Organization, Key Indicators of the Labour Market database.
Categories, topics:
Social Protection & Labor
Last updated:
apr 23, 2017
Indicators value changes by year
Minimum:
14.962
jan 1, 2007
Maximum:
16.775
jan 1, 2012
At the date of observation
Value
Absolute change
Change from previous value
jan 1, 2005
15.47
+15.47
0.0%
jan 1, 2006
15.878
+0.408
2.64%
jan 1, 2007
14.962
-0.916
-5.77%
jan 1, 2008
14.969
+0.007
0.05%
jan 1, 2009
15.185
+0.216
1.44%
jan 1, 2010
15.659
+0.474
3.12%
jan 1, 2011
15.544
-0.115
-0.73%
jan 1, 2012
16.775
+1.231
7.92%
jan 1, 2013
15.319
-1.456
-8.68%
Ranking of countries by current statistics by years


Comments: