29
/
en
AIzaSyAYiBZKx7MnpbEhh9jyipgxe19OcubqV5w
April 1, 2024
224321
Philippines
PHL
true
2
1
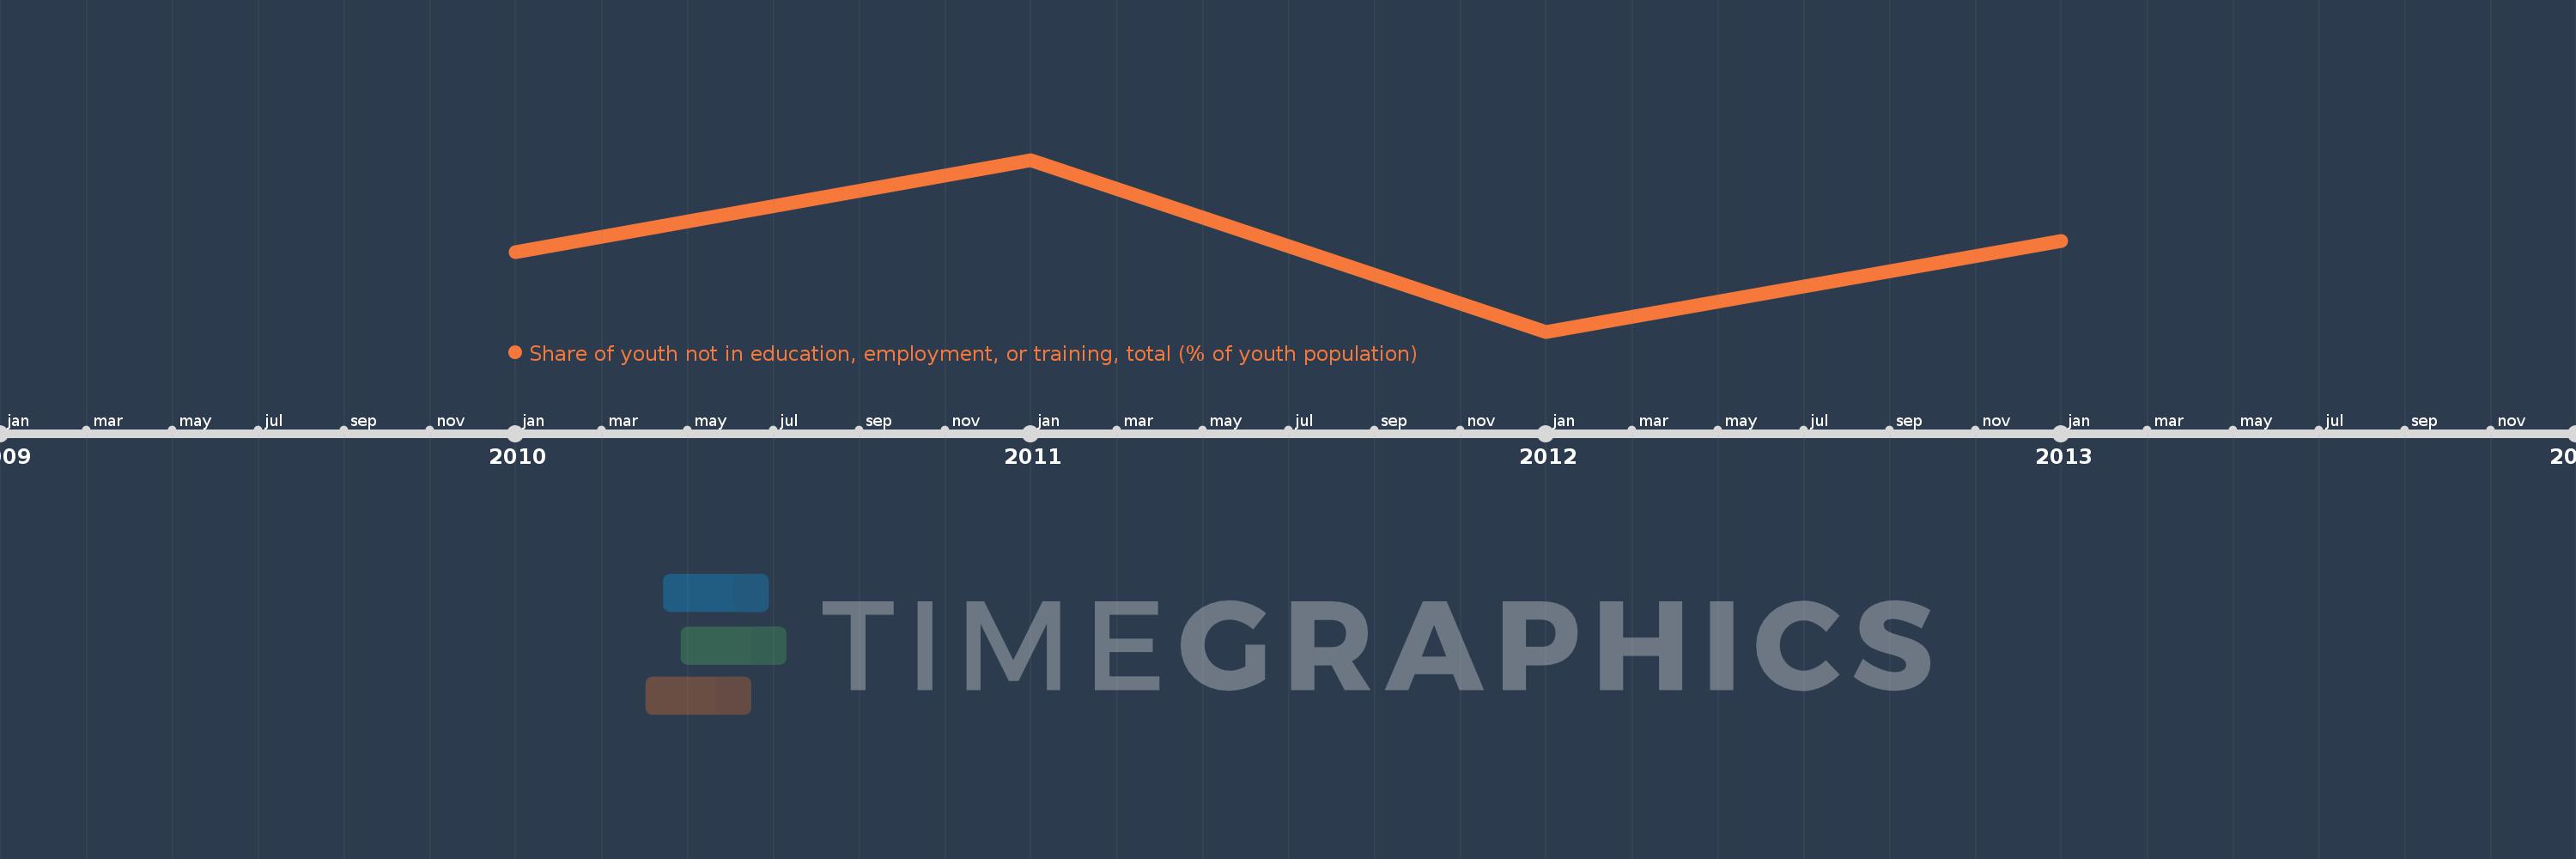
Share of youth not in education, employment, or training, total (% of youth population)
2013,2012,2011,2010
This statistics in other country:
Timeline:
This timeline shows a graph from 2010 to 2013 of Philippines. No data until 2009. Number of actual observations by date: 4.
Source name:
World Development Indicators
Source organization:
International Labour Organization, Key Indicators of the Labour Market database.
Categories, topics:
Social Protection & Labor
Last updated:
apr 23, 2017
Indicators value changes by year
At the date of observation
Value
Absolute change
Change from previous value
jan 1, 2010
24.72
+24.72
0.0%
jan 1, 2011
25.21
+0.49
1.98%
jan 1, 2012
24.3
-0.91
-3.61%
jan 1, 2013
24.78
+0.48
1.98%
Ranking of countries by current statistics by years


Comments: