29
/
en
AIzaSyAYiBZKx7MnpbEhh9jyipgxe19OcubqV5w
April 1, 2024
74399
Austria
AUT
true
2
1
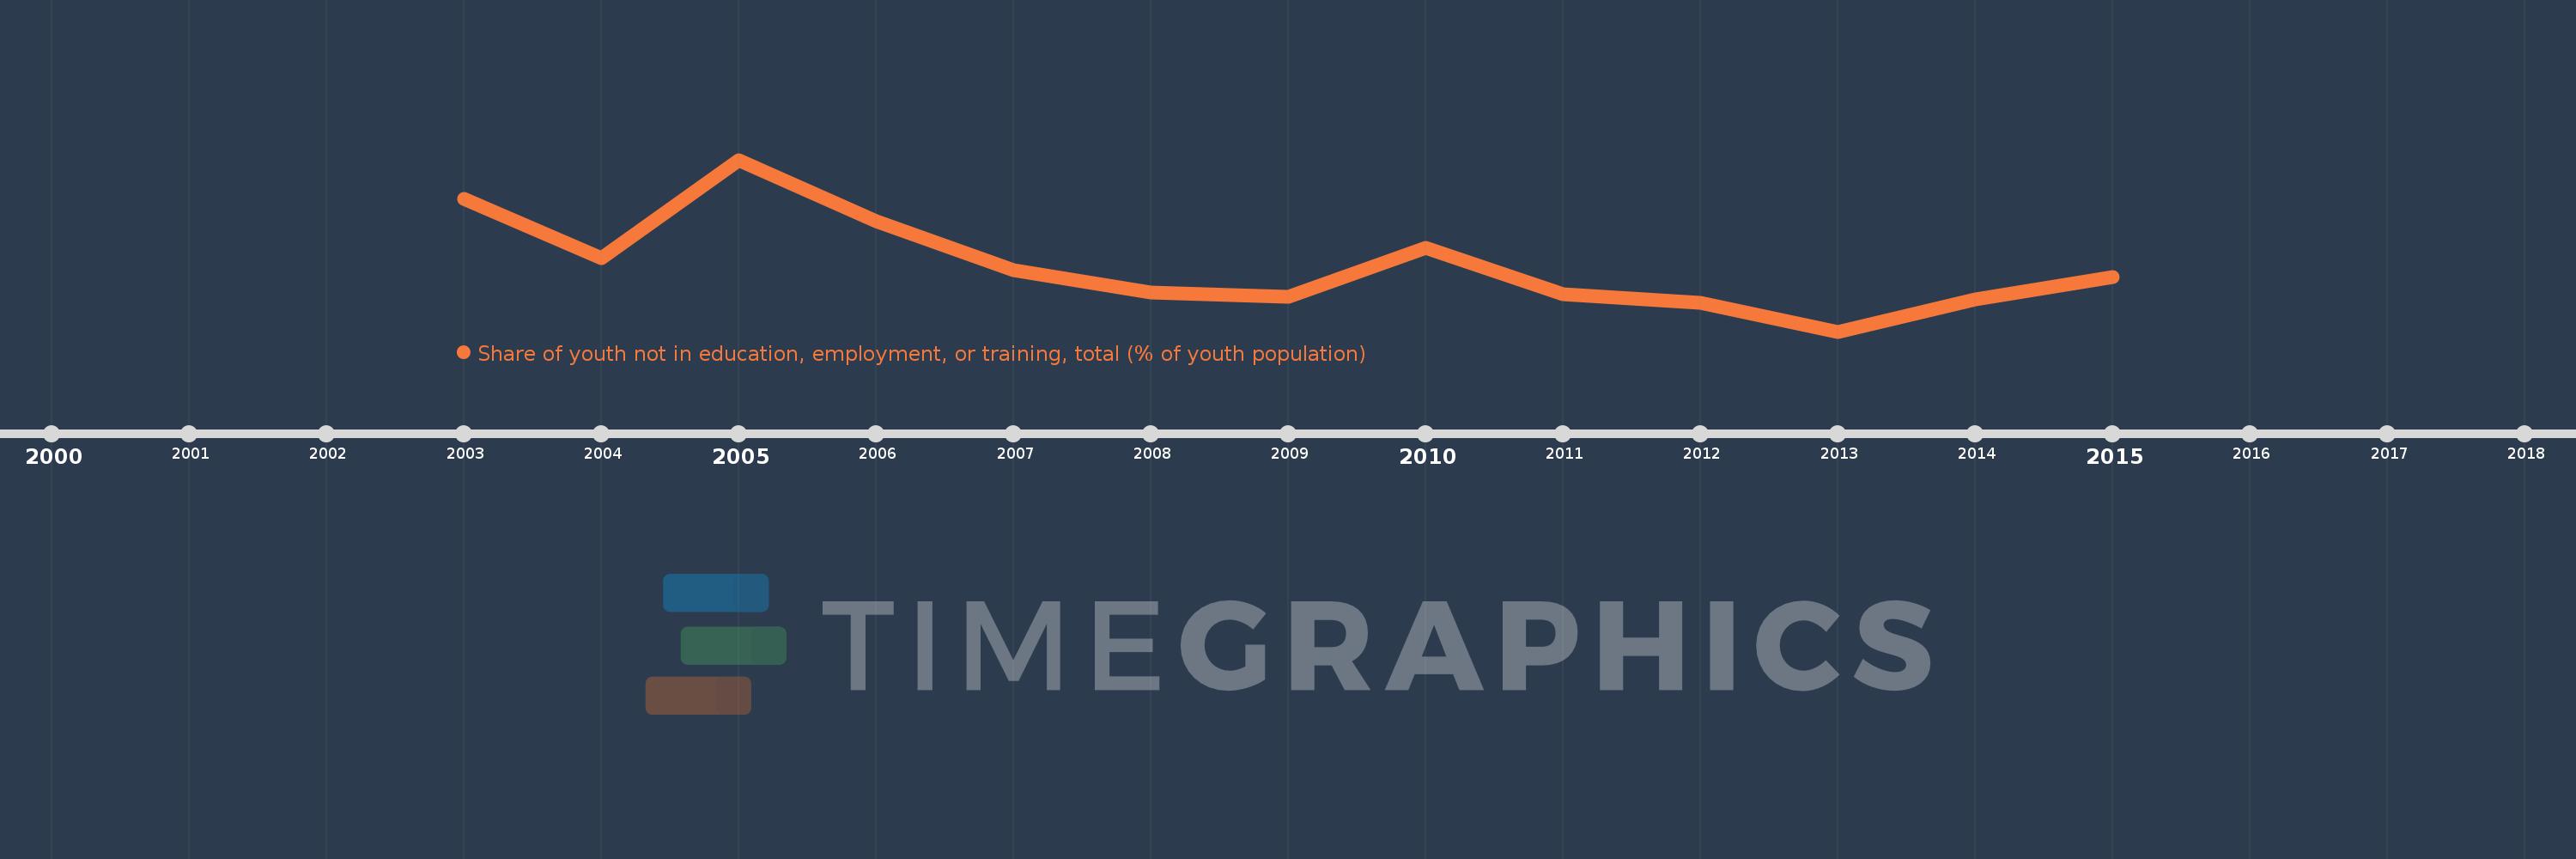
Share of youth not in education, employment, or training, total (% of youth population)
2015,2014,2013,2012,2011,2010,2009,2008,2007,2006,2005,2004,2003
This statistics in other country:
Timeline:
This timeline shows a graph from 2003 to 2015 of Austria. No data until 2002. Number of actual observations by date: 13.
Source name:
World Development Indicators
Source organization:
International Labour Organization, Key Indicators of the Labour Market database.
Categories, topics:
Social Protection & Labor
Last updated:
apr 23, 2017
Indicators value changes by year
At the date of observation
Value
Absolute change
Change from previous value
jan 1, 2004
8.01
-0.99
-11.0%
jan 1, 2005
9.64
+1.63
20.35%
jan 1, 2006
8.62
-1.02
-10.58%
jan 1, 2007
7.81
-0.81
-9.4%
jan 1, 2008
7.44
-0.37
-4.74%
jan 1, 2009
7.38
-0.06
-0.81%
jan 1, 2010
8.19
+0.81
10.98%
jan 1, 2011
7.42
-0.77
-9.4%
jan 1, 2012
7.28
-0.14
-1.89%
jan 1, 2013
6.8
-0.48
-6.59%
jan 1, 2014
7.33
+0.53
7.79%
jan 1, 2015
7.7
+0.37
5.05%
Ranking of countries by current statistics by years


Comments: