29
/
en
AIzaSyAYiBZKx7MnpbEhh9jyipgxe19OcubqV5w
April 1, 2024
30237
Euro area
EMU
false
2
1
Progression to secondary school, male (%)
2014,2013,2012,2011,2010,2009,2008,2007,2006,2005,2004,2003,2002,2001,2000,1999,1998,1997,1996,1995,1994,1993,1992,1991,1990,1989,1988,1987,1986,1985,1984,1983,1982,1981,1978,1977,1976
This statistics in other country:
AfghanistanAlbaniaAlgeriaAngolaAntigua and BarbudaArab WorldArgentinaArmeniaArubaAustriaAzerbaijanBahamas, TheBahrainBarbadosBelarusBelgiumBelizeBeninBermudaBhutanBoliviaBosnia and HerzegovinaBotswanaBrazilBritish Virgin IslandsBrunei DarussalamBulgariaBurkina FasoBurundiCabo VerdeCambodiaCameroonCaribbean small statesCayman IslandsCentral African RepublicCentral Europe and the BalticsChadChileChinaColombiaComorosCongo, Dem. Rep.Congo, Rep.Costa RicaCote d'IvoireCroatiaCubaCyprusCzech RepublicDenmarkDjiboutiDominicaDominican RepublicEarly-demographic dividendEast Asia & PacificEast Asia & Pacific (excluding high income)East Asia & Pacific (IDA & IBRD countries)EcuadorEgypt, Arab Rep.El SalvadorEquatorial GuineaEritreaEstoniaEthiopiaEuro areaEurope & Central AsiaEurope & Central Asia (excluding high income)Europe & Central Asia (IDA & IBRD countries)European UnionFijiFinlandFragile and conflict affected situationsGabonGambia, TheGeorgiaGermanyGhanaGreeceGrenadaGuatemalaGuineaGuinea-BissauGuyanaHaitiHeavily indebted poor countries (HIPC)High incomeHondurasHong Kong SAR, ChinaHungaryIBRD onlyIcelandIDA & IBRD totalIDA blendIDA onlyIDA totalIndiaIndonesiaIran, Islamic Rep.IraqIsraelItalyJamaicaJapanJordanKazakhstanKenyaKiribatiKorea, Rep.KuwaitKyrgyz RepublicLao PDRLate-demographic dividendLatin America & Caribbean Latin America & Caribbean (excluding high income)Latin America & the Caribbean (IDA & IBRD countries)LatviaLeast developed countries: UN classificationLebanonLesothoLiberiaLibyaLiechtensteinLithuaniaLow & middle incomeLow incomeLower middle incomeLuxembourgMacao SAR, ChinaMacedonia, FYRMadagascarMalawiMalaysiaMaldivesMaliMaltaMarshall IslandsMauritaniaMauritiusMexicoMiddle East & North AfricaMiddle East & North Africa (excluding high income)Middle East & North Africa (IDA & IBRD countries)Middle incomeMoldovaMonacoMongoliaMoroccoMozambiqueMyanmarNamibiaNepalNetherlandsNicaraguaNigerNorwayOECD membersOmanOther small statesPacific island small statesPakistanPalauPanamaParaguayPeruPhilippinesPolandPortugalPost-demographic dividendPre-demographic dividendQatarRomaniaRussian FederationRwandaSamoaSan MarinoSao Tome and PrincipeSaudi ArabiaSenegalSerbiaSeychellesSierra LeoneSingaporeSlovak RepublicSloveniaSmall statesSolomon IslandsSouth AfricaSouth AsiaSouth Asia (IDA & IBRD)SpainSri LankaSt. Kitts and NevisSt. LuciaSt. Vincent and the GrenadinesSub-Saharan Africa Sub-Saharan Africa (excluding high income)Sub-Saharan Africa (IDA & IBRD countries)SudanSurinameSwazilandSwedenSwitzerlandSyrian Arab RepublicTajikistanTanzaniaThailandTimor-LesteTogoTongaTrinidad and TobagoTunisiaTurkeyTurks and Caicos IslandsTuvaluUgandaUkraineUnited Arab EmiratesUpper middle incomeUruguayUzbekistanVanuatuVenezuela, RBVietnamWest Bank and GazaWorldYemen, Rep.ZambiaZimbabwe Timeline:
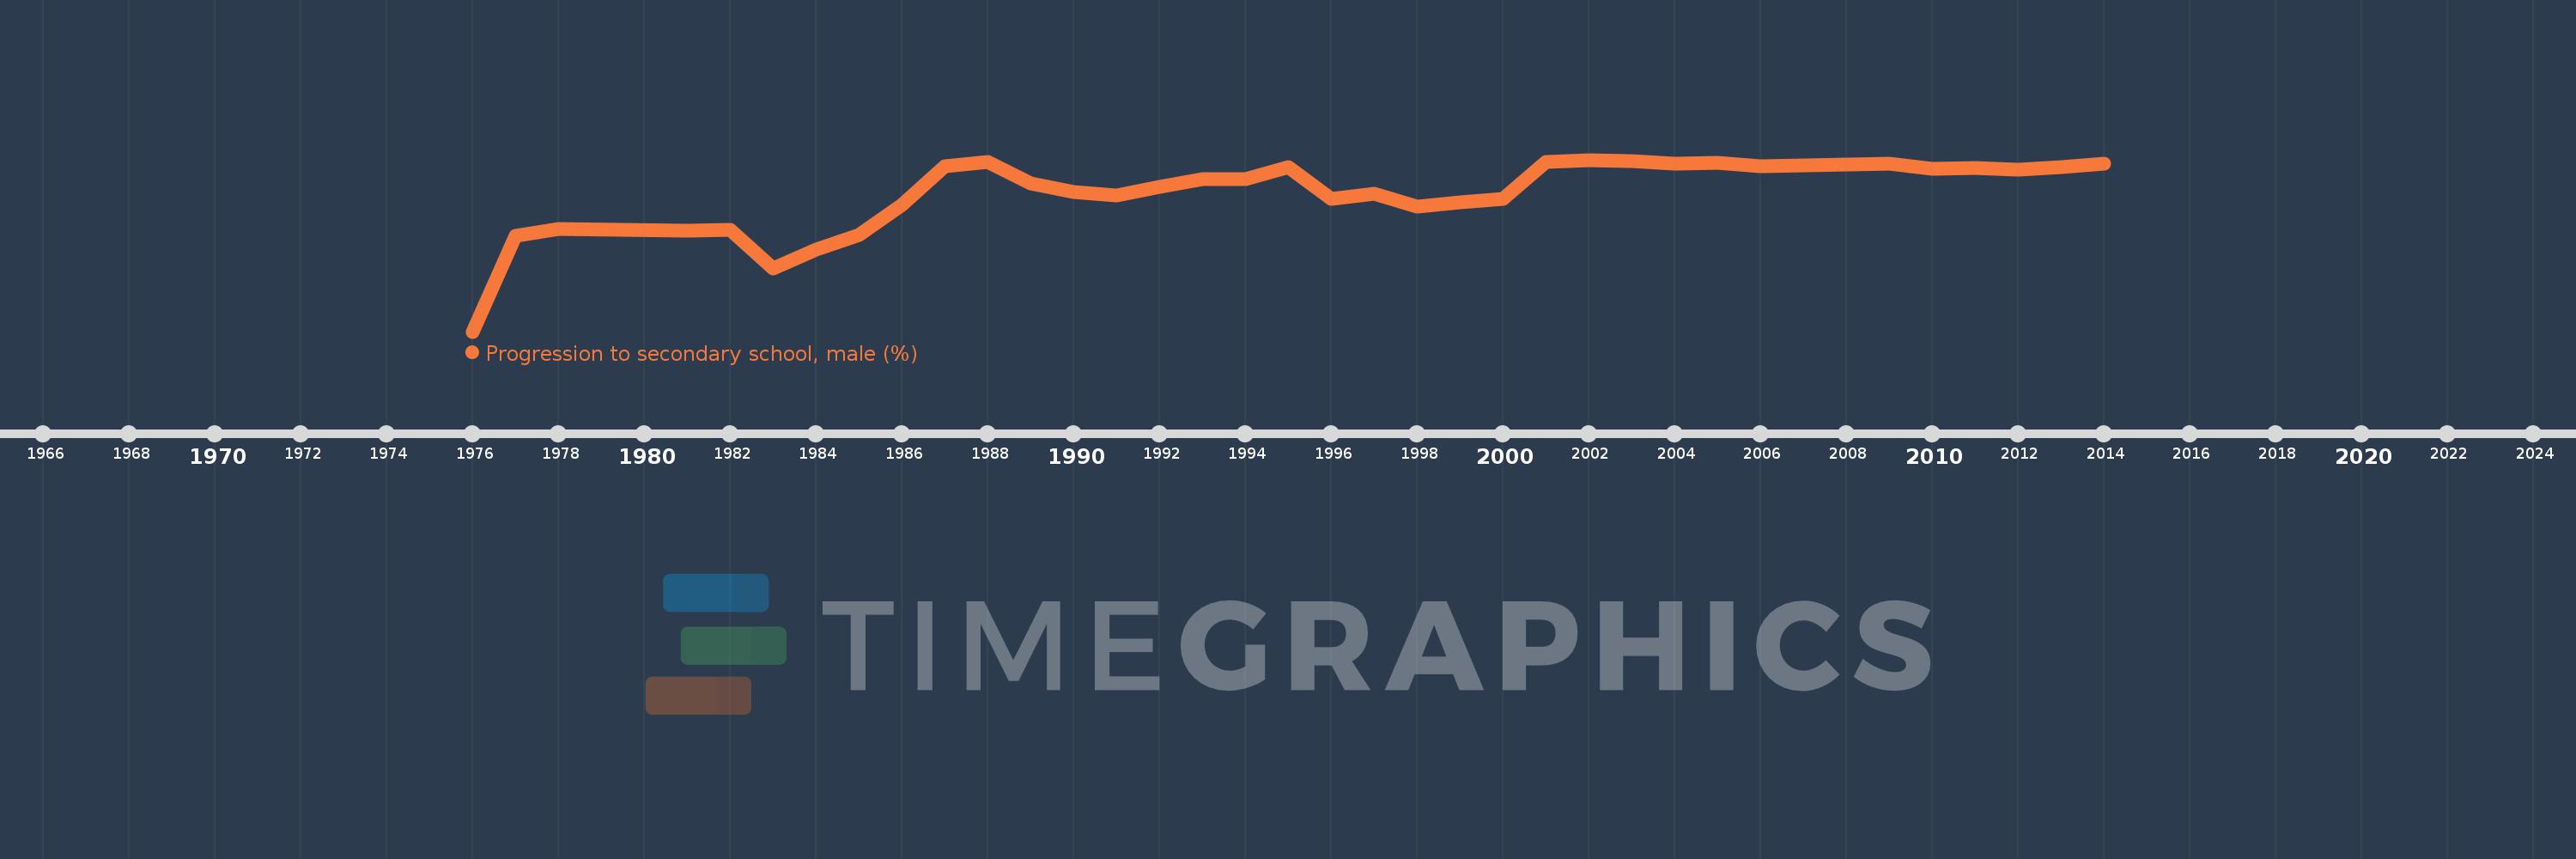
This timeline shows a graph from 1976 to 2014 of Euro area. No data until 1975. Number of actual observations by date: 37.
Source name:
World Development Indicators
Source organization:
United Nations Educational, Scientific, and Cultural Organization (UNESCO) Institute for Statistics.
Categories, topics:
Education, Gender
Last updated:
apr 23, 2017
Indicators value changes by year
Minimum:
91.807
jan 1, 1976
Maximum:
98.005
jan 1, 2002
At the date of observation
Value
Absolute change
Change from previous value
jan 1, 1976
91.807
+91.807
0.0%
jan 1, 1977
95.257
+3.45
3.76%
jan 1, 1978
95.523
+0.266
0.28%
jan 1, 1981
95.446
-0.076
-0.08%
jan 1, 1982
95.487
+0.041
0.04%
jan 1, 1983
94.075
-1.412
-1.48%
jan 1, 1984
94.778
+0.704
0.75%
jan 1, 1985
95.294
+0.515
0.54%
jan 1, 1986
96.393
+1.099
1.15%
jan 1, 1987
97.758
+1.366
1.42%
jan 1, 1988
97.921
+0.163
0.17%
jan 1, 1989
97.162
-0.76
-0.78%
jan 1, 1990
96.831
-0.331
-0.34%
jan 1, 1991
96.705
-0.125
-0.13%
jan 1, 1992
97.039
+0.333
0.34%
jan 1, 1993
97.314
+0.275
0.28%
jan 1, 1994
97.311
-0.003
0.0%
jan 1, 1995
97.74
+0.429
0.44%
jan 1, 1996
96.593
-1.147
-1.17%
jan 1, 1997
96.781
+0.188
0.19%
jan 1, 1998
96.303
-0.478
-0.49%
jan 1, 1999
96.485
+0.183
0.19%
jan 1, 2000
96.605
+0.119
0.12%
jan 1, 2001
97.933
+1.328
1.37%
jan 1, 2002
98.005
+0.072
0.07%
jan 1, 2003
97.973
-0.032
-0.03%
jan 1, 2004
97.857
-0.116
-0.12%
jan 1, 2005
97.883
+0.027
0.03%
jan 1, 2006
97.773
-0.111
-0.11%
jan 1, 2007
97.809
+0.036
0.04%
jan 1, 2008
97.84
+0.031
0.03%
jan 1, 2009
97.851
+0.011
0.01%
jan 1, 2010
97.681
-0.17
-0.17%
jan 1, 2011
97.701
+0.02
0.02%
jan 1, 2012
97.64
-0.061
-0.06%
jan 1, 2013
97.751
+0.111
0.11%
jan 1, 2014
97.874
+0.123
0.13%
Ranking of countries by current statistics by years


Comments: