29
/
en
AIzaSyAYiBZKx7MnpbEhh9jyipgxe19OcubqV5w
April 1, 2024
187149
Malawi
MWI
true
2
1
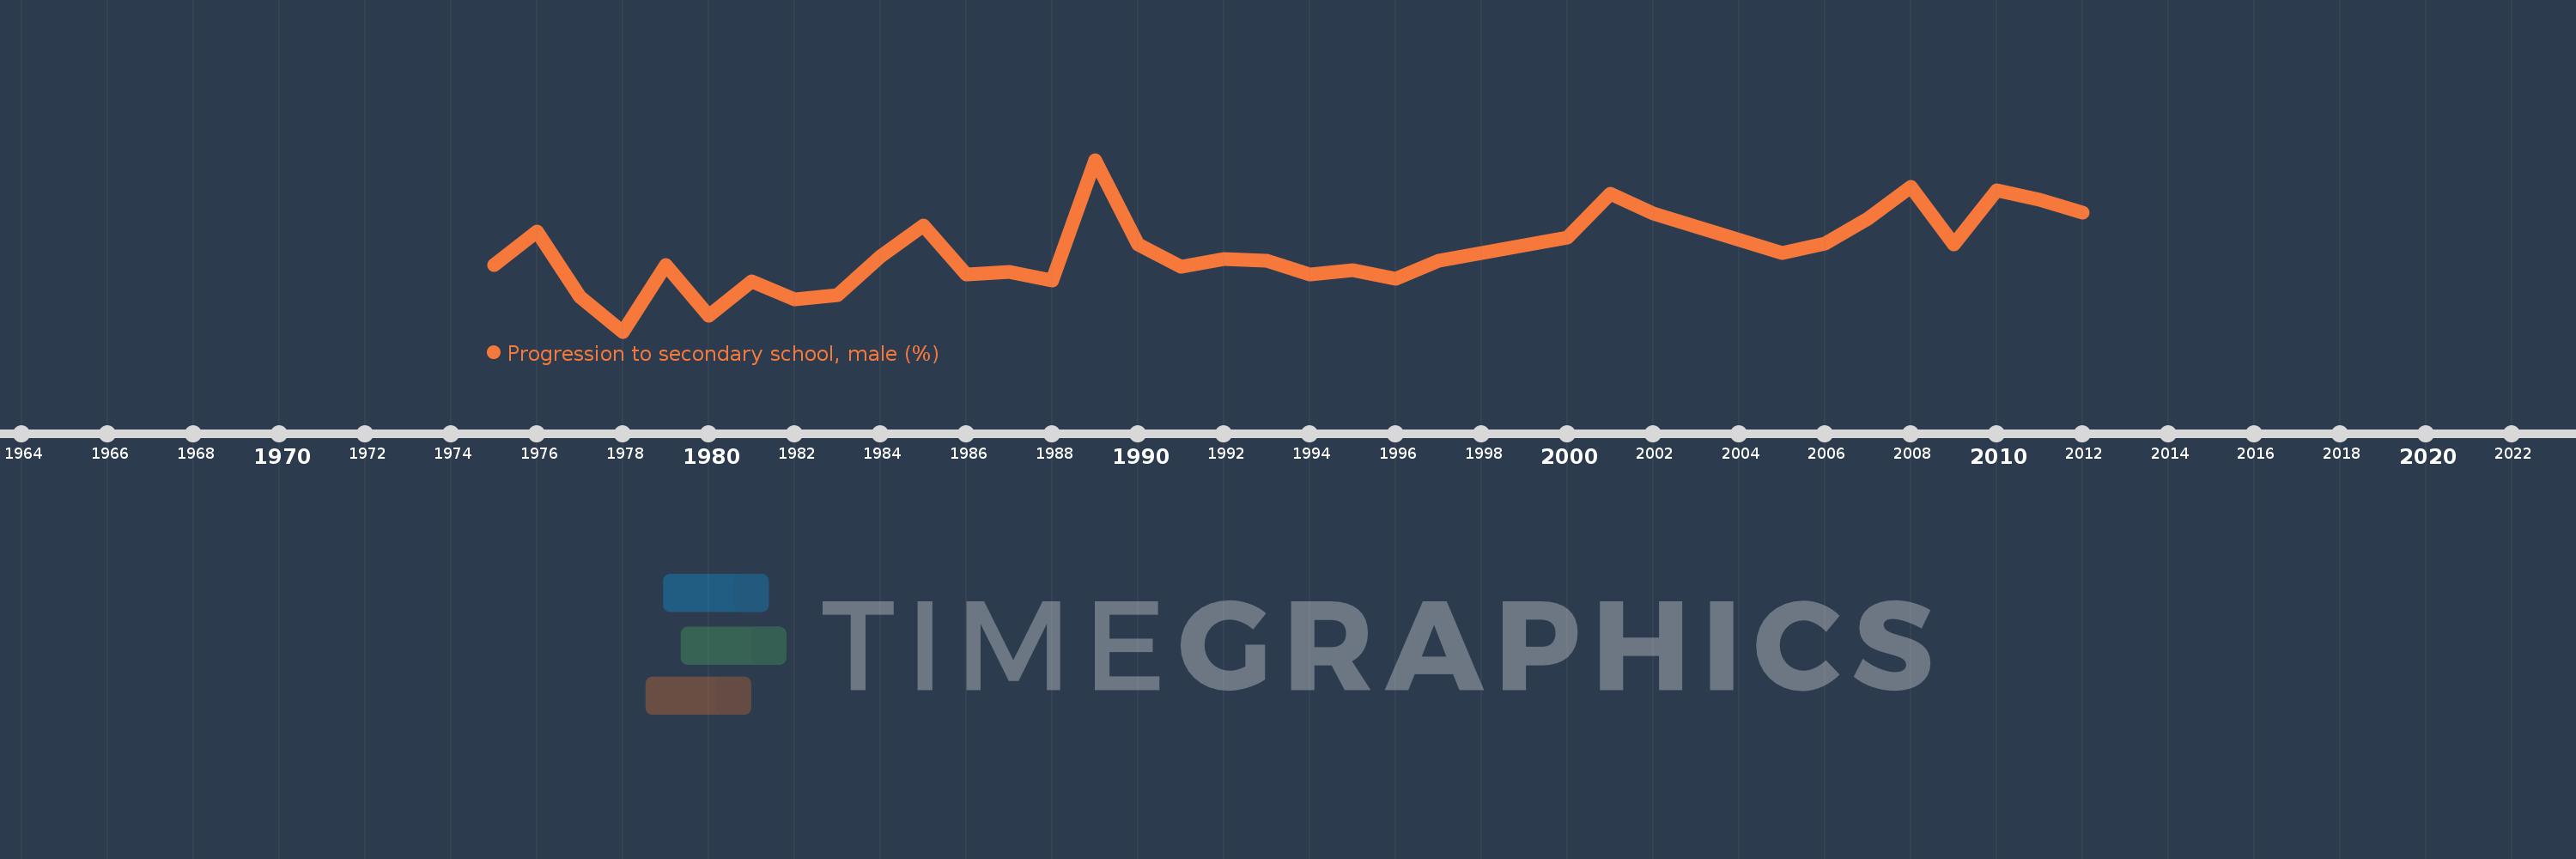
Progression to secondary school, male (%)
2012,2011,2010,2009,2008,2007,2006,2005,2002,2001,2000,1997,1996,1995,1994,1993,1992,1991,1990,1989,1988,1987,1986,1985,1984,1983,1982,1981,1980,1979,1978,1977,1976,1975
This statistics in other country:
AfghanistanAlbaniaAlgeriaAngolaAntigua and BarbudaArab WorldArgentinaArmeniaArubaAustriaAzerbaijanBahamas, TheBahrainBarbadosBelarusBelgiumBelizeBeninBermudaBhutanBoliviaBosnia and HerzegovinaBotswanaBrazilBritish Virgin IslandsBrunei DarussalamBulgariaBurkina FasoBurundiCabo VerdeCambodiaCameroonCaribbean small statesCayman IslandsCentral African RepublicCentral Europe and the BalticsChadChileChinaColombiaComorosCongo, Dem. Rep.Congo, Rep.Costa RicaCote d'IvoireCroatiaCubaCyprusCzech RepublicDenmarkDjiboutiDominicaDominican RepublicEarly-demographic dividendEast Asia & PacificEast Asia & Pacific (excluding high income)East Asia & Pacific (IDA & IBRD countries)EcuadorEgypt, Arab Rep.El SalvadorEquatorial GuineaEritreaEstoniaEthiopiaEuro areaEurope & Central AsiaEurope & Central Asia (excluding high income)Europe & Central Asia (IDA & IBRD countries)European UnionFijiFinlandFragile and conflict affected situationsGabonGambia, TheGeorgiaGermanyGhanaGreeceGrenadaGuatemalaGuineaGuinea-BissauGuyanaHaitiHeavily indebted poor countries (HIPC)High incomeHondurasHong Kong SAR, ChinaHungaryIBRD onlyIcelandIDA & IBRD totalIDA blendIDA onlyIDA totalIndiaIndonesiaIran, Islamic Rep.IraqIsraelItalyJamaicaJapanJordanKazakhstanKenyaKiribatiKorea, Rep.KuwaitKyrgyz RepublicLao PDRLate-demographic dividendLatin America & Caribbean Latin America & Caribbean (excluding high income)Latin America & the Caribbean (IDA & IBRD countries)LatviaLeast developed countries: UN classificationLebanonLesothoLiberiaLibyaLiechtensteinLithuaniaLow & middle incomeLow incomeLower middle incomeLuxembourgMacao SAR, ChinaMacedonia, FYRMadagascarMalawiMalaysiaMaldivesMaliMaltaMarshall IslandsMauritaniaMauritiusMexicoMiddle East & North AfricaMiddle East & North Africa (excluding high income)Middle East & North Africa (IDA & IBRD countries)Middle incomeMoldovaMonacoMongoliaMoroccoMozambiqueMyanmarNamibiaNepalNetherlandsNicaraguaNigerNorwayOECD membersOmanOther small statesPacific island small statesPakistanPalauPanamaParaguayPeruPhilippinesPolandPortugalPost-demographic dividendPre-demographic dividendQatarRomaniaRussian FederationRwandaSamoaSan MarinoSao Tome and PrincipeSaudi ArabiaSenegalSerbiaSeychellesSierra LeoneSingaporeSlovak RepublicSloveniaSmall statesSolomon IslandsSouth AfricaSouth AsiaSouth Asia (IDA & IBRD)SpainSri LankaSt. Kitts and NevisSt. LuciaSt. Vincent and the GrenadinesSub-Saharan Africa Sub-Saharan Africa (excluding high income)Sub-Saharan Africa (IDA & IBRD countries)SudanSurinameSwazilandSwedenSwitzerlandSyrian Arab RepublicTajikistanTanzaniaThailandTimor-LesteTogoTongaTrinidad and TobagoTunisiaTurkeyTurks and Caicos IslandsTuvaluUgandaUkraineUnited Arab EmiratesUpper middle incomeUruguayUzbekistanVanuatuVenezuela, RBVietnamWest Bank and GazaWorldYemen, Rep.ZambiaZimbabwe Timeline:
This timeline shows a graph from 1975 to 2012 of Malawi. No data until 1974. Number of actual observations by date: 34.
Source name:
World Development Indicators
Source organization:
United Nations Educational, Scientific, and Cultural Organization (UNESCO) Institute for Statistics.
Categories, topics:
Education, Gender
Last updated:
apr 23, 2017
Indicators value changes by year
Minimum:
75.102
jan 1, 1978
Maximum:
94.398
jan 1, 1989
At the date of observation
Value
Absolute change
Change from previous value
jan 1, 1975
82.554
+82.554
0.0%
jan 1, 1976
86.39
+3.835
4.65%
jan 1, 1977
78.991
-7.398
-8.56%
jan 1, 1978
75.102
-3.89
-4.92%
jan 1, 1979
82.603
+7.501
9.99%
jan 1, 1980
76.927
-5.676
-6.87%
jan 1, 1981
80.732
+3.805
4.95%
jan 1, 1982
78.688
-2.043
-2.53%
jan 1, 1983
79.223
+0.535
0.68%
jan 1, 1984
83.585
+4.362
5.51%
jan 1, 1985
86.983
+3.398
4.07%
jan 1, 1986
81.536
-5.448
-6.26%
jan 1, 1987
81.763
+0.227
0.28%
jan 1, 1988
80.869
-0.894
-1.09%
jan 1, 1989
94.398
+13.528
16.73%
jan 1, 1990
84.877
-9.52
-10.09%
jan 1, 1991
82.344
-2.533
-2.98%
jan 1, 1992
83.226
+0.882
1.07%
jan 1, 1993
83.048
-0.178
-0.21%
jan 1, 1994
81.561
-1.488
-1.79%
jan 1, 1995
81.983
+0.423
0.52%
jan 1, 1996
81.004
-0.979
-1.19%
jan 1, 1997
83.087
+2.083
2.57%
jan 1, 2000
85.7
+2.613
3.14%
jan 1, 2001
90.584
+4.884
5.7%
jan 1, 2002
88.394
-2.19
-2.42%
jan 1, 2005
83.973
-4.421
-5.0%
jan 1, 2006
84.98
+1.006
1.2%
jan 1, 2007
87.825
+2.845
3.35%
jan 1, 2008
91.39
+3.566
4.06%
jan 1, 2009
84.865
-6.525
-7.14%
jan 1, 2010
91.003
+6.138
7.23%
jan 1, 2011
89.923
-1.08
-1.19%
jan 1, 2012
88.439
-1.484
-1.65%
Ranking of countries by current statistics by years


Comments: