29
/
en
AIzaSyAYiBZKx7MnpbEhh9jyipgxe19OcubqV5w
April 1, 2024
227819
Qatar
QAT
true
2
1
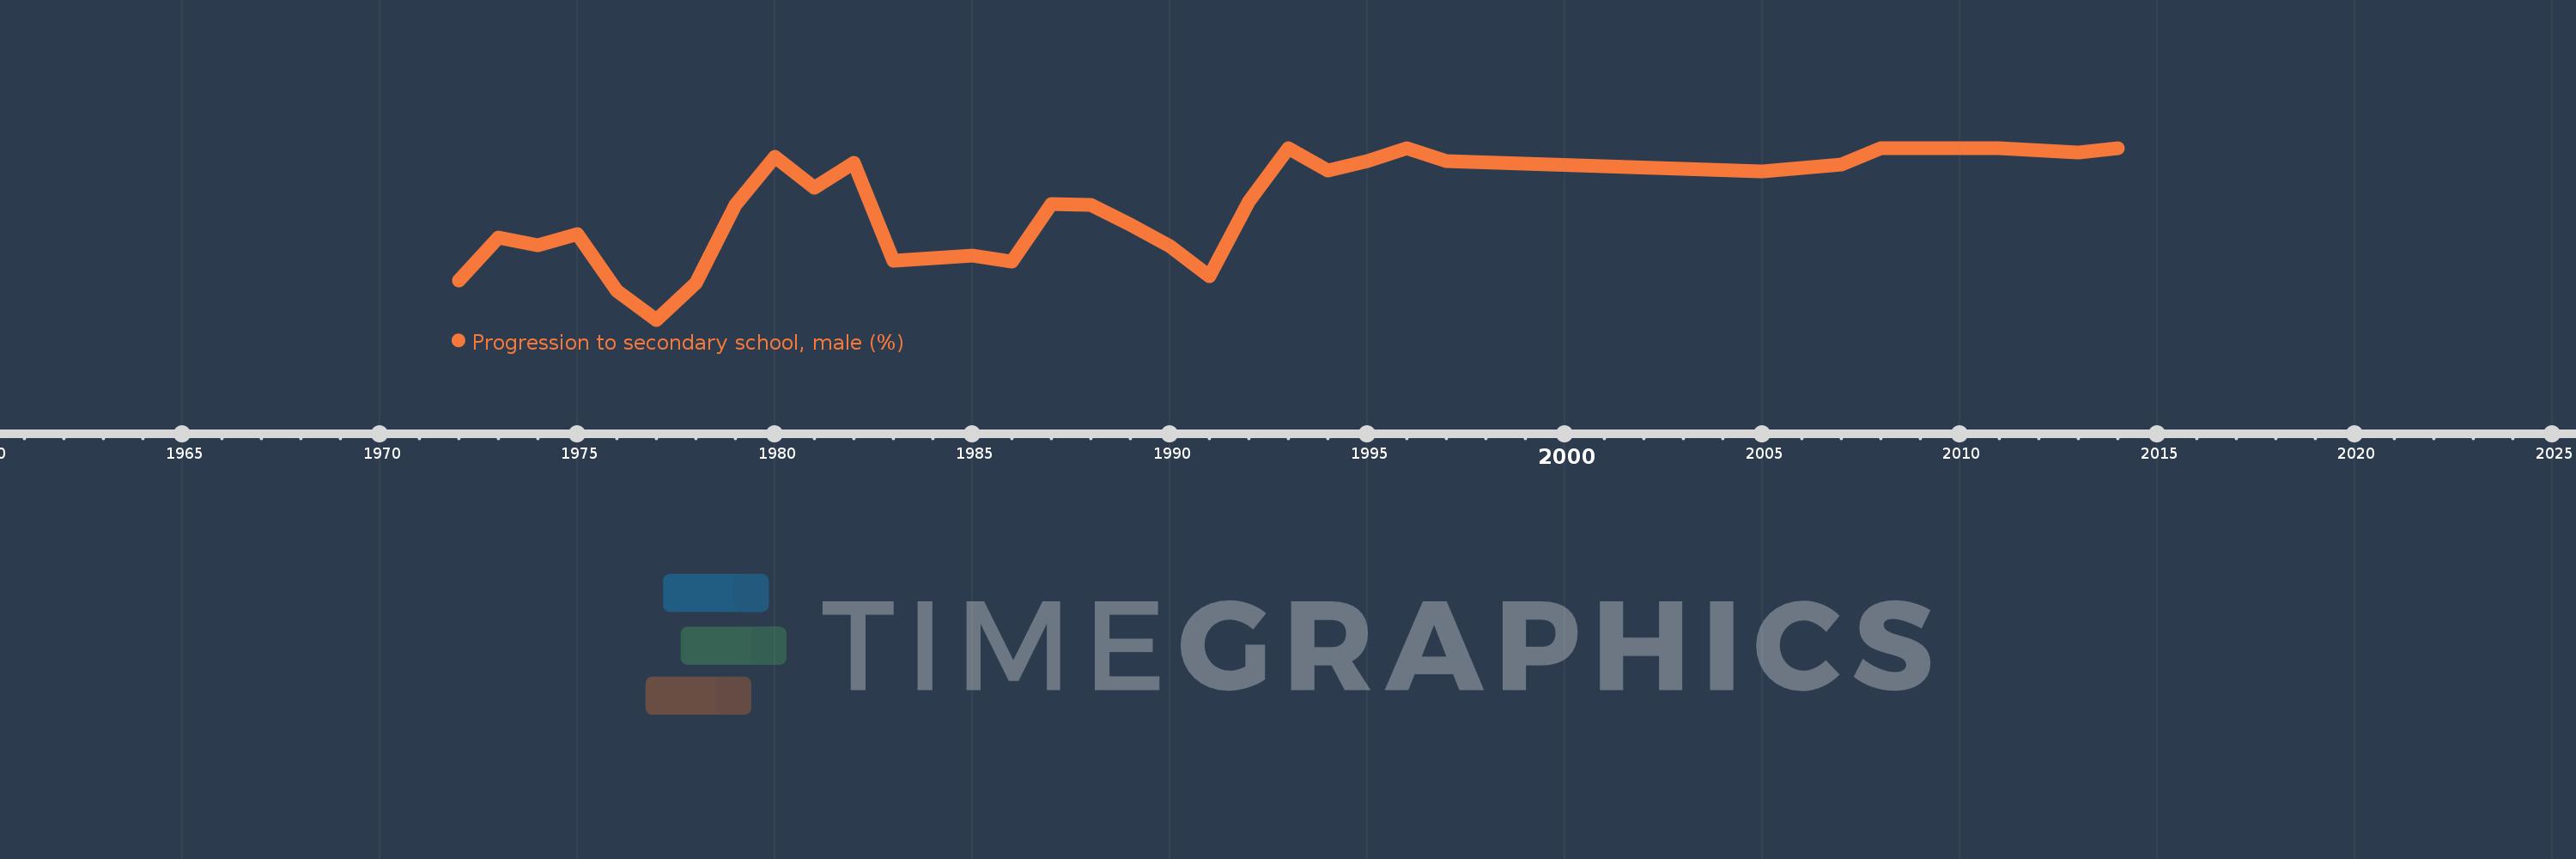
Progression to secondary school, male (%)
2014,2013,2011,2009,2008,2007,2006,2005,1997,1996,1995,1994,1993,1992,1991,1990,1989,1988,1987,1986,1985,1983,1982,1981,1980,1979,1978,1977,1976,1975,1974,1973,1972
This statistics in other country:
AfghanistanAlbaniaAlgeriaAngolaAntigua and BarbudaArab WorldArgentinaArmeniaArubaAustriaAzerbaijanBahamas, TheBahrainBarbadosBelarusBelgiumBelizeBeninBermudaBhutanBoliviaBosnia and HerzegovinaBotswanaBrazilBritish Virgin IslandsBrunei DarussalamBulgariaBurkina FasoBurundiCabo VerdeCambodiaCameroonCaribbean small statesCayman IslandsCentral African RepublicCentral Europe and the BalticsChadChileChinaColombiaComorosCongo, Dem. Rep.Congo, Rep.Costa RicaCote d'IvoireCroatiaCubaCyprusCzech RepublicDenmarkDjiboutiDominicaDominican RepublicEarly-demographic dividendEast Asia & PacificEast Asia & Pacific (excluding high income)East Asia & Pacific (IDA & IBRD countries)EcuadorEgypt, Arab Rep.El SalvadorEquatorial GuineaEritreaEstoniaEthiopiaEuro areaEurope & Central AsiaEurope & Central Asia (excluding high income)Europe & Central Asia (IDA & IBRD countries)European UnionFijiFinlandFragile and conflict affected situationsGabonGambia, TheGeorgiaGermanyGhanaGreeceGrenadaGuatemalaGuineaGuinea-BissauGuyanaHaitiHeavily indebted poor countries (HIPC)High incomeHondurasHong Kong SAR, ChinaHungaryIBRD onlyIcelandIDA & IBRD totalIDA blendIDA onlyIDA totalIndiaIndonesiaIran, Islamic Rep.IraqIsraelItalyJamaicaJapanJordanKazakhstanKenyaKiribatiKorea, Rep.KuwaitKyrgyz RepublicLao PDRLate-demographic dividendLatin America & Caribbean Latin America & Caribbean (excluding high income)Latin America & the Caribbean (IDA & IBRD countries)LatviaLeast developed countries: UN classificationLebanonLesothoLiberiaLibyaLiechtensteinLithuaniaLow & middle incomeLow incomeLower middle incomeLuxembourgMacao SAR, ChinaMacedonia, FYRMadagascarMalawiMalaysiaMaldivesMaliMaltaMarshall IslandsMauritaniaMauritiusMexicoMiddle East & North AfricaMiddle East & North Africa (excluding high income)Middle East & North Africa (IDA & IBRD countries)Middle incomeMoldovaMonacoMongoliaMoroccoMozambiqueMyanmarNamibiaNepalNetherlandsNicaraguaNigerNorwayOECD membersOmanOther small statesPacific island small statesPakistanPalauPanamaParaguayPeruPhilippinesPolandPortugalPost-demographic dividendPre-demographic dividendQatarRomaniaRussian FederationRwandaSamoaSan MarinoSao Tome and PrincipeSaudi ArabiaSenegalSerbiaSeychellesSierra LeoneSingaporeSlovak RepublicSloveniaSmall statesSolomon IslandsSouth AfricaSouth AsiaSouth Asia (IDA & IBRD)SpainSri LankaSt. Kitts and NevisSt. LuciaSt. Vincent and the GrenadinesSub-Saharan Africa Sub-Saharan Africa (excluding high income)Sub-Saharan Africa (IDA & IBRD countries)SudanSurinameSwazilandSwedenSwitzerlandSyrian Arab RepublicTajikistanTanzaniaThailandTimor-LesteTogoTongaTrinidad and TobagoTunisiaTurkeyTurks and Caicos IslandsTuvaluUgandaUkraineUnited Arab EmiratesUpper middle incomeUruguayUzbekistanVanuatuVenezuela, RBVietnamWest Bank and GazaWorldYemen, Rep.ZambiaZimbabwe Timeline:
This timeline shows a graph from 1972 to 2014 of Qatar. No data until 1971. Number of actual observations by date: 33.
Source name:
World Development Indicators
Source organization:
United Nations Educational, Scientific, and Cultural Organization (UNESCO) Institute for Statistics.
Categories, topics:
Education, Gender
Last updated:
apr 23, 2017
Indicators value changes by year
Minimum:
76.588
jan 1, 1977
At the date of observation
Value
Absolute change
Change from previous value
jan 1, 1972
81.915
+81.915
0.0%
jan 1, 1973
87.817
+5.902
7.2%
jan 1, 1974
86.743
-1.074
-1.22%
jan 1, 1975
88.255
+1.513
1.74%
jan 1, 1976
80.567
-7.688
-8.71%
jan 1, 1977
76.588
-3.979
-4.94%
jan 1, 1978
81.628
+5.04
6.58%
jan 1, 1979
92.262
+10.633
13.03%
jan 1, 1980
98.821
+6.56
7.11%
jan 1, 1981
94.617
-4.204
-4.25%
jan 1, 1982
97.991
+3.374
3.57%
jan 1, 1983
84.58
-13.411
-13.69%
jan 1, 1985
85.373
+0.794
0.94%
jan 1, 1986
84.498
-0.876
-1.03%
jan 1, 1987
92.36
+7.862
9.3%
jan 1, 1988
92.232
-0.128
-0.14%
jan 1, 1989
89.529
-2.703
-2.93%
jan 1, 1990
86.612
-2.917
-3.26%
jan 1, 1991
82.502
-4.11
-4.75%
jan 1, 1992
92.763
+10.261
12.44%
jan 1, 1993
100.0
+7.237
7.8%
jan 1, 1994
96.907
-3.093
-3.09%
jan 1, 1995
98.235
+1.329
1.37%
jan 1, 1996
100.0
+1.765
1.8%
jan 1, 1997
98.261
-1.739
-1.74%
jan 1, 2005
96.769
-1.493
-1.52%
jan 1, 2006
97.259
+0.49
0.51%
jan 1, 2007
97.766
+0.507
0.52%
jan 1, 2008
100.0
+2.234
2.29%
jan 1, 2009
100.0
0.0
0.0%
jan 1, 2011
99.95
-0.05
-0.05%
jan 1, 2013
99.416
-0.534
-0.53%
jan 1, 2014
100.0
+0.584
0.59%
Ranking of countries by current statistics by years


Comments: