29
/
en
AIzaSyAYiBZKx7MnpbEhh9jyipgxe19OcubqV5w
April 1, 2024
172149
Kuwait
KWT
true
2
1
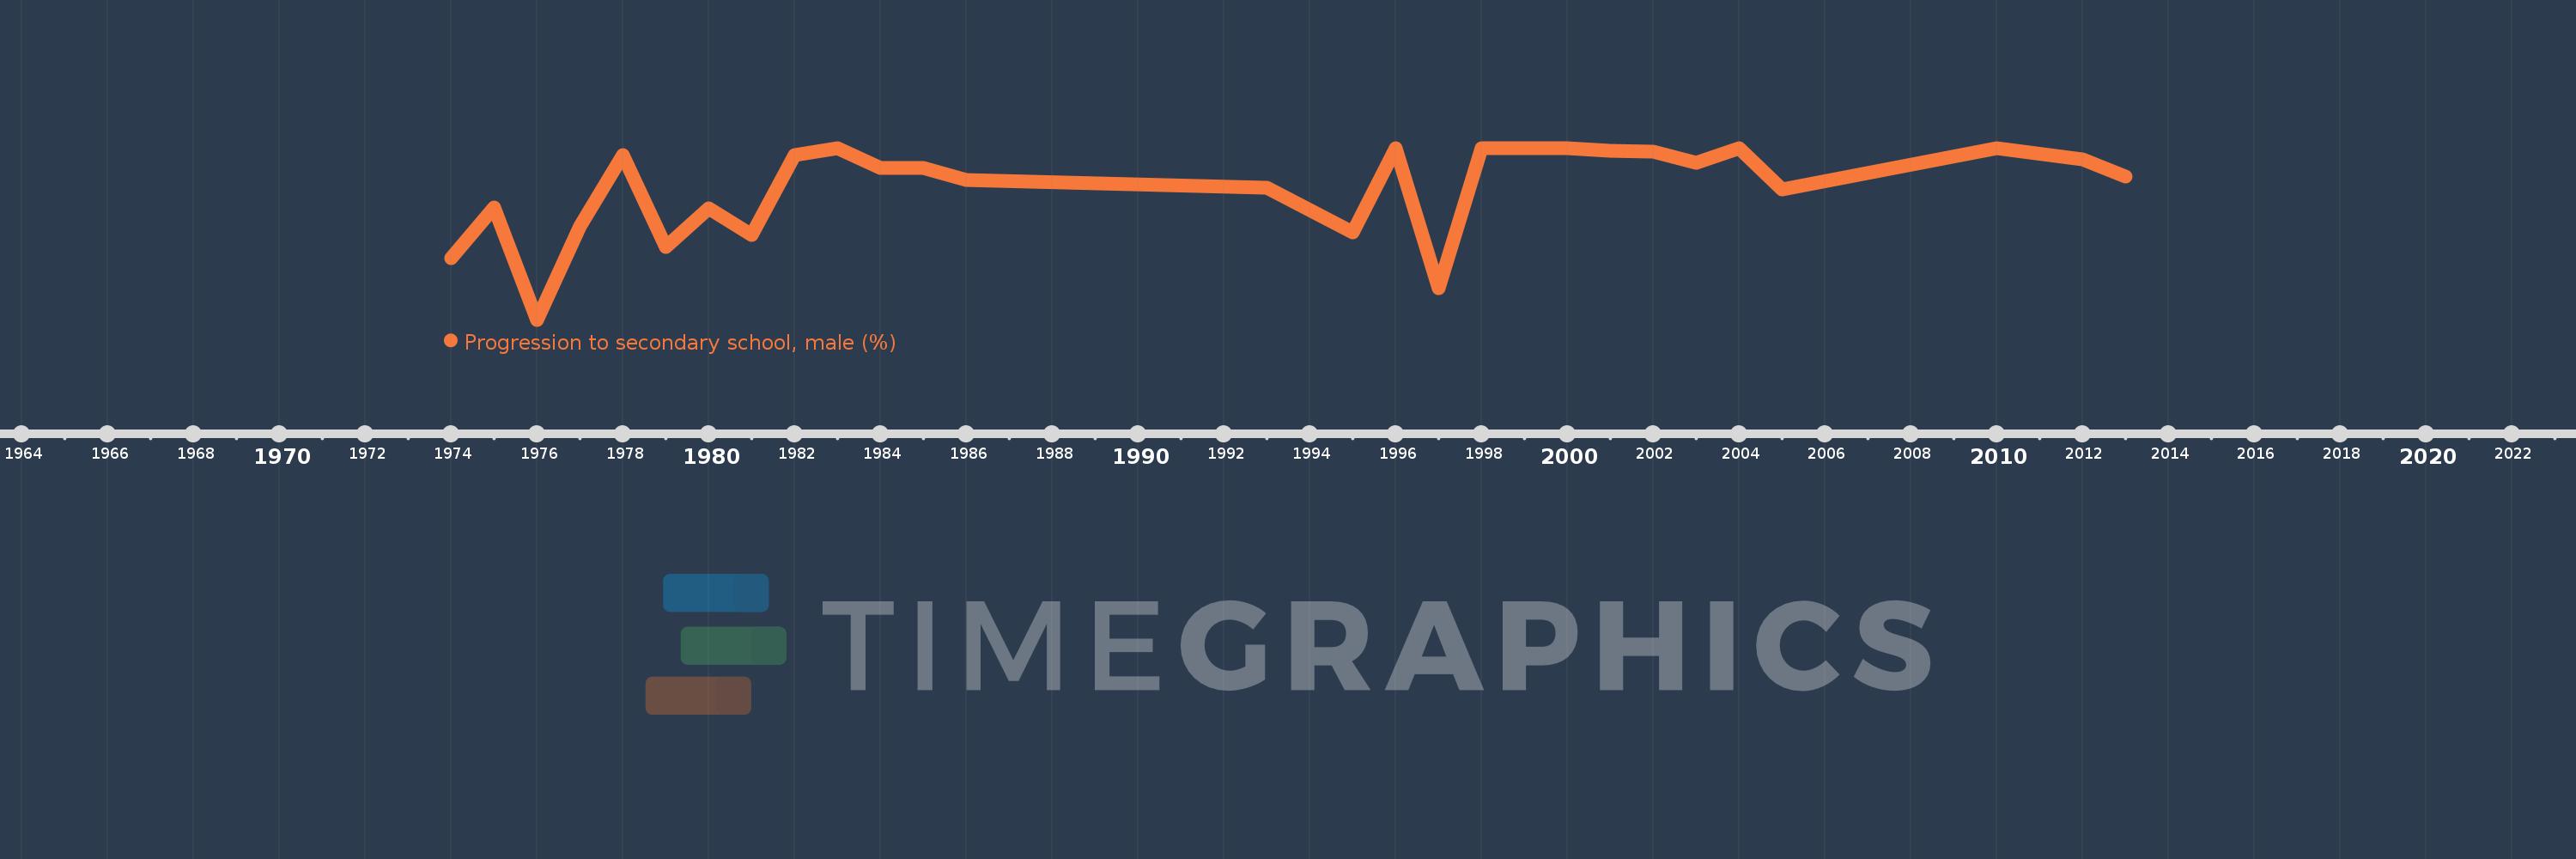
Progression to secondary school, male (%)
2013,2012,2010,2005,2004,2003,2002,2001,2000,1999,1998,1997,1996,1995,1993,1986,1985,1984,1983,1982,1981,1980,1979,1978,1977,1976,1975,1974
This statistics in other country:
AfghanistanAlbaniaAlgeriaAngolaAntigua and BarbudaArab WorldArgentinaArmeniaArubaAustriaAzerbaijanBahamas, TheBahrainBarbadosBelarusBelgiumBelizeBeninBermudaBhutanBoliviaBosnia and HerzegovinaBotswanaBrazilBritish Virgin IslandsBrunei DarussalamBulgariaBurkina FasoBurundiCabo VerdeCambodiaCameroonCaribbean small statesCayman IslandsCentral African RepublicCentral Europe and the BalticsChadChileChinaColombiaComorosCongo, Dem. Rep.Congo, Rep.Costa RicaCote d'IvoireCroatiaCubaCyprusCzech RepublicDenmarkDjiboutiDominicaDominican RepublicEarly-demographic dividendEast Asia & PacificEast Asia & Pacific (excluding high income)East Asia & Pacific (IDA & IBRD countries)EcuadorEgypt, Arab Rep.El SalvadorEquatorial GuineaEritreaEstoniaEthiopiaEuro areaEurope & Central AsiaEurope & Central Asia (excluding high income)Europe & Central Asia (IDA & IBRD countries)European UnionFijiFinlandFragile and conflict affected situationsGabonGambia, TheGeorgiaGermanyGhanaGreeceGrenadaGuatemalaGuineaGuinea-BissauGuyanaHaitiHeavily indebted poor countries (HIPC)High incomeHondurasHong Kong SAR, ChinaHungaryIBRD onlyIcelandIDA & IBRD totalIDA blendIDA onlyIDA totalIndiaIndonesiaIran, Islamic Rep.IraqIsraelItalyJamaicaJapanJordanKazakhstanKenyaKiribatiKorea, Rep.KuwaitKyrgyz RepublicLao PDRLate-demographic dividendLatin America & Caribbean Latin America & Caribbean (excluding high income)Latin America & the Caribbean (IDA & IBRD countries)LatviaLeast developed countries: UN classificationLebanonLesothoLiberiaLibyaLiechtensteinLithuaniaLow & middle incomeLow incomeLower middle incomeLuxembourgMacao SAR, ChinaMacedonia, FYRMadagascarMalawiMalaysiaMaldivesMaliMaltaMarshall IslandsMauritaniaMauritiusMexicoMiddle East & North AfricaMiddle East & North Africa (excluding high income)Middle East & North Africa (IDA & IBRD countries)Middle incomeMoldovaMonacoMongoliaMoroccoMozambiqueMyanmarNamibiaNepalNetherlandsNicaraguaNigerNorwayOECD membersOmanOther small statesPacific island small statesPakistanPalauPanamaParaguayPeruPhilippinesPolandPortugalPost-demographic dividendPre-demographic dividendQatarRomaniaRussian FederationRwandaSamoaSan MarinoSao Tome and PrincipeSaudi ArabiaSenegalSerbiaSeychellesSierra LeoneSingaporeSlovak RepublicSloveniaSmall statesSolomon IslandsSouth AfricaSouth AsiaSouth Asia (IDA & IBRD)SpainSri LankaSt. Kitts and NevisSt. LuciaSt. Vincent and the GrenadinesSub-Saharan Africa Sub-Saharan Africa (excluding high income)Sub-Saharan Africa (IDA & IBRD countries)SudanSurinameSwazilandSwedenSwitzerlandSyrian Arab RepublicTajikistanTanzaniaThailandTimor-LesteTogoTongaTrinidad and TobagoTunisiaTurkeyTurks and Caicos IslandsTuvaluUgandaUkraineUnited Arab EmiratesUpper middle incomeUruguayUzbekistanVanuatuVenezuela, RBVietnamWest Bank and GazaWorldYemen, Rep.ZambiaZimbabwe Timeline:
This timeline shows a graph from 1974 to 2013 of Kuwait. No data until 1973. Number of actual observations by date: 28.
Source name:
World Development Indicators
Source organization:
United Nations Educational, Scientific, and Cultural Organization (UNESCO) Institute for Statistics.
Categories, topics:
Education, Gender
Last updated:
apr 23, 2017
Indicators value changes by year
Minimum:
81.558
jan 1, 1976
At the date of observation
Value
Absolute change
Change from previous value
jan 1, 1974
88.126
+88.126
0.0%
jan 1, 1975
93.57
+5.444
6.18%
jan 1, 1976
81.558
-12.012
-12.84%
jan 1, 1977
91.584
+10.026
12.29%
jan 1, 1978
99.247
+7.663
8.37%
jan 1, 1979
89.352
-9.895
-9.97%
jan 1, 1980
93.487
+4.135
4.63%
jan 1, 1981
90.685
-2.801
-3.0%
jan 1, 1982
99.194
+8.509
9.38%
jan 1, 1983
100.0
+0.806
0.81%
jan 1, 1984
97.847
-2.153
-2.15%
jan 1, 1985
97.837
-0.01
-0.01%
jan 1, 1986
96.566
-1.271
-1.3%
jan 1, 1993
95.763
-0.804
-0.83%
jan 1, 1995
90.946
-4.816
-5.03%
jan 1, 1996
100.0
+9.054
9.96%
jan 1, 1997
84.972
-15.028
-15.03%
jan 1, 1998
100.0
+15.028
17.69%
jan 1, 1999
100.0
0.0
0.0%
jan 1, 2000
100.0
0.0
0.0%
jan 1, 2001
99.723
-0.277
-0.28%
jan 1, 2002
99.569
-0.155
-0.16%
jan 1, 2003
98.412
-1.156
-1.16%
jan 1, 2004
100.0
+1.588
1.61%
jan 1, 2005
95.591
-4.409
-4.41%
jan 1, 2010
99.936
+4.345
4.55%
jan 1, 2012
98.738
-1.198
-1.2%
jan 1, 2013
96.965
-1.772
-1.79%
Ranking of countries by current statistics by years


Comments: