29
/
en
AIzaSyAYiBZKx7MnpbEhh9jyipgxe19OcubqV5w
April 1, 2024
28754
East Asia & Pacific (excluding high income)
EAP
false
2
1
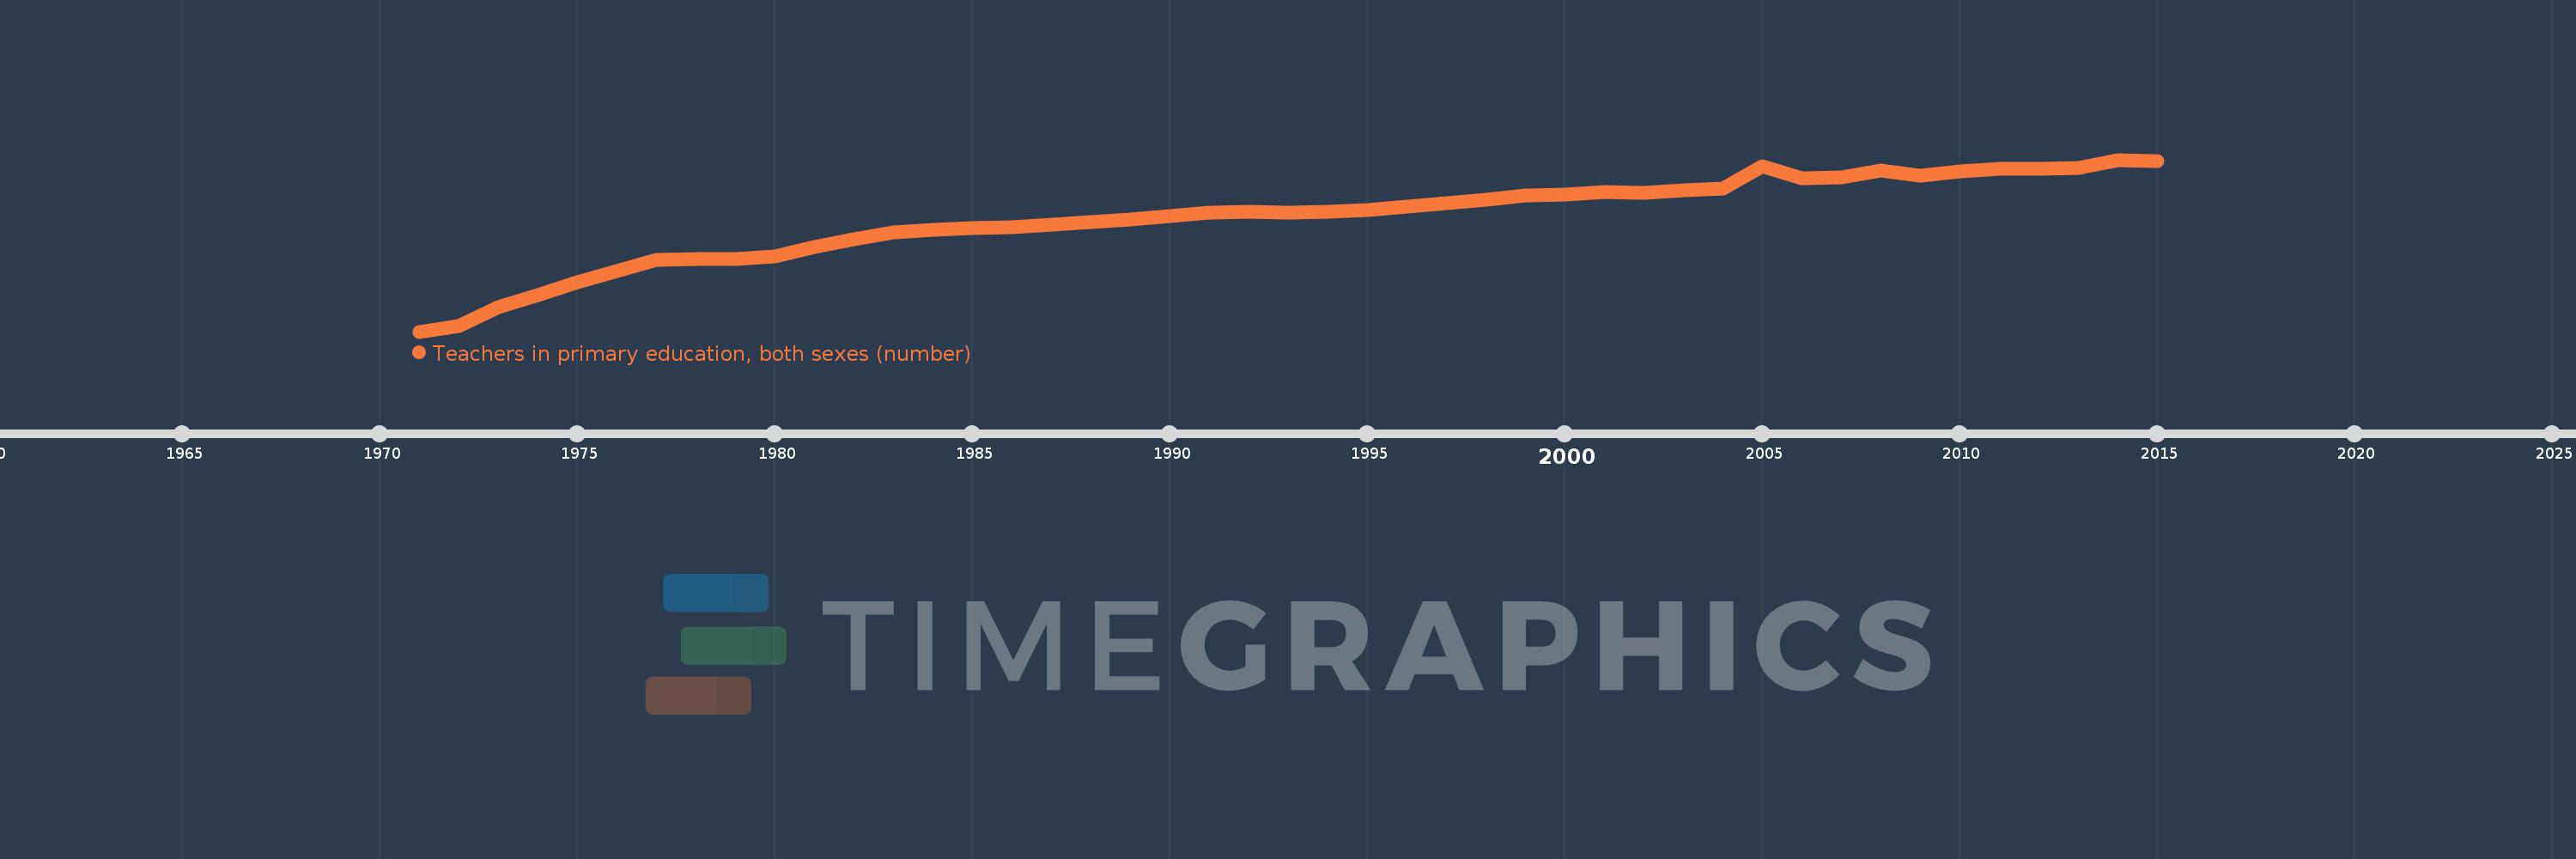
Teachers in primary education, both sexes (number)
2015,2014,2013,2012,2011,2010,2009,2008,2007,2006,2005,2004,2003,2002,2001,2000,1999,1998,1997,1996,1995,1994,1993,1992,1991,1990,1989,1988,1987,1986,1985,1984,1983,1982,1981,1980,1979,1978,1977,1976,1975,1974,1973,1972,1971
This statistics in other country:
AfghanistanAlbaniaAlgeriaAmerican SamoaAndorraAngolaAntigua and BarbudaArab WorldArgentinaArmeniaArubaAustraliaAustriaAzerbaijanBahamas, TheBahrainBangladeshBarbadosBelarusBelgiumBelizeBeninBermudaBhutanBoliviaBosnia and HerzegovinaBotswanaBrazilBritish Virgin IslandsBrunei DarussalamBulgariaBurkina FasoBurundiCabo VerdeCambodiaCameroonCanadaCaribbean small statesCayman IslandsCentral African RepublicCentral Europe and the BalticsChadChileChinaColombiaComorosCongo, Dem. Rep.Congo, Rep.Costa RicaCote d'IvoireCroatiaCubaCyprusCzech RepublicDenmarkDjiboutiDominicaDominican RepublicEarly-demographic dividendEast Asia & PacificEast Asia & Pacific (excluding high income)East Asia & Pacific (IDA & IBRD countries)EcuadorEgypt, Arab Rep.El SalvadorEquatorial GuineaEritreaEstoniaEthiopiaEuro areaEurope & Central AsiaEurope & Central Asia (excluding high income)Europe & Central Asia (IDA & IBRD countries)European UnionFijiFinlandFragile and conflict affected situationsFranceFrench PolynesiaGabonGambia, TheGeorgiaGermanyGhanaGibraltarGreeceGrenadaGuamGuatemalaGuineaGuinea-BissauGuyanaHaitiHeavily indebted poor countries (HIPC)High incomeHondurasHong Kong SAR, ChinaHungaryIBRD onlyIcelandIDA & IBRD totalIDA blendIDA onlyIDA totalIndiaIndonesiaIran, Islamic Rep.IraqIrelandIsraelItalyJamaicaJapanJordanKazakhstanKenyaKiribatiKorea, Dem. People’s Rep.Korea, Rep.KuwaitKyrgyz RepublicLao PDRLate-demographic dividendLatin America & Caribbean Latin America & Caribbean (excluding high income)Latin America & the Caribbean (IDA & IBRD countries)LatviaLeast developed countries: UN classificationLebanonLesothoLiberiaLibyaLiechtensteinLithuaniaLow & middle incomeLow incomeLower middle incomeLuxembourgMacao SAR, ChinaMacedonia, FYRMadagascarMalawiMalaysiaMaldivesMaliMaltaMarshall IslandsMauritaniaMauritiusMexicoMicronesia, Fed. Sts.Middle East & North AfricaMiddle East & North Africa (excluding high income)Middle East & North Africa (IDA & IBRD countries)Middle incomeMoldovaMonacoMongoliaMoroccoMozambiqueMyanmarNamibiaNauruNepalNetherlandsNew CaledoniaNew ZealandNicaraguaNigerNigeriaNorth AmericaNorwayOECD membersOmanOther small statesPacific island small statesPakistanPalauPanamaPapua New GuineaParaguayPeruPhilippinesPolandPortugalPost-demographic dividendPre-demographic dividendPuerto RicoQatarRomaniaRussian FederationRwandaSamoaSan MarinoSao Tome and PrincipeSaudi ArabiaSenegalSerbiaSeychellesSierra LeoneSingaporeSint Maarten (Dutch part)Slovak RepublicSloveniaSmall statesSolomon IslandsSomaliaSouth AfricaSouth AsiaSouth Asia (IDA & IBRD)South SudanSpainSri LankaSt. Kitts and NevisSt. LuciaSt. Vincent and the GrenadinesSub-Saharan Africa Sub-Saharan Africa (excluding high income)Sub-Saharan Africa (IDA & IBRD countries)SudanSurinameSwazilandSwedenSwitzerlandSyrian Arab RepublicTajikistanTanzaniaThailandTimor-LesteTogoTongaTrinidad and TobagoTunisiaTurkeyTurks and Caicos IslandsTuvaluUgandaUkraineUnited Arab EmiratesUnited KingdomUnited StatesUpper middle incomeUruguayUzbekistanVanuatuVenezuela, RBVietnamVirgin Islands (U.S.)West Bank and GazaWorldYemen, Rep.ZambiaZimbabwe Timeline:
This timeline shows a graph from 1971 to 2015 of East Asia & Pacific (excluding high income). No data until 1970. Number of actual observations by date: 45.
Source name:
World Development Indicators
Source organization:
UNESCO Institute for Statistics
Categories, topics:
Education
Last updated:
apr 23, 2017
Indicators value changes by year
Minimum:
4.819 mln
jan 1, 1971
Maximum:
9.585 mln
jan 1, 2014
At the date of observation
Value
Absolute change
Change from previous value
jan 1, 1971
4.819 mln
+4.819 mln
0.0%
jan 1, 1972
4.98 mln
+161.577K
3.35%
jan 1, 1973
5.509 mln
+528.529K
10.61%
jan 1, 1974
5.842 mln
+333.021K
6.05%
jan 1, 1975
6.178 mln
+336.466K
5.76%
jan 1, 1976
6.495 mln
+316.414K
5.12%
jan 1, 1977
6.811 mln
+316.455K
4.87%
jan 1, 1978
6.829 mln
+17.753K
0.26%
jan 1, 1979
6.842 mln
+13.658K
0.2%
jan 1, 1980
6.908 mln
+65.129K
0.95%
jan 1, 1981
7.169 mln
+261.695K
3.79%
jan 1, 1982
7.381 mln
+212.18K
2.96%
jan 1, 1983
7.57 mln
+188.734K
2.56%
jan 1, 1984
7.643 mln
+73.322K
0.97%
jan 1, 1985
7.68 mln
+36.206K
0.47%
jan 1, 1986
7.713 mln
+33.663K
0.44%
jan 1, 1987
7.775 mln
+62.016K
0.8%
jan 1, 1988
7.86 mln
+84.975K
1.09%
jan 1, 1989
7.935 mln
+74.337K
0.95%
jan 1, 1990
8.035 mln
+100.301K
1.26%
jan 1, 1991
8.121 mln
+86.218K
1.07%
jan 1, 1992
8.148 mln
+26.915K
0.33%
jan 1, 1993
8.124 mln
-24.043K
-0.3%
jan 1, 1994
8.151 mln
+27.278K
0.34%
jan 1, 1995
8.195 mln
+44.117K
0.54%
jan 1, 1996
8.285 mln
+89.981K
1.1%
jan 1, 1997
8.378 mln
+92.434K
1.12%
jan 1, 1998
8.483 mln
+104.861K
1.25%
jan 1, 1999
8.587 mln
+104.412K
1.23%
jan 1, 2000
8.628 mln
+41.298K
0.48%
jan 1, 2001
8.689 mln
+60.187K
0.7%
jan 1, 2002
8.663 mln
-25.201K
-0.29%
jan 1, 2003
8.737 mln
+73.58K
0.85%
jan 1, 2004
8.782 mln
+45.102K
0.52%
jan 1, 2005
9.412 mln
+629.742K
7.17%
jan 1, 2006
9.077 mln
-334.461K
-3.55%
jan 1, 2007
9.106 mln
+28.768K
0.32%
jan 1, 2008
9.292 mln
+185.539K
2.04%
jan 1, 2009
9.143 mln
-148.663K
-1.6%
jan 1, 2010
9.265 mln
+122.009K
1.33%
jan 1, 2011
9.337 mln
+71.548K
0.77%
jan 1, 2012
9.329 mln
-7.65K
-0.08%
jan 1, 2013
9.358 mln
+29.386K
0.31%
jan 1, 2014
9.585 mln
+226.938K
2.42%
jan 1, 2015
9.545 mln
-40.501K
-0.42%
Ranking of countries by current statistics by years


Comments: