29
/
en
AIzaSyAYiBZKx7MnpbEhh9jyipgxe19OcubqV5w
April 1, 2024
261677
Tanzania
TZA
true
2
1
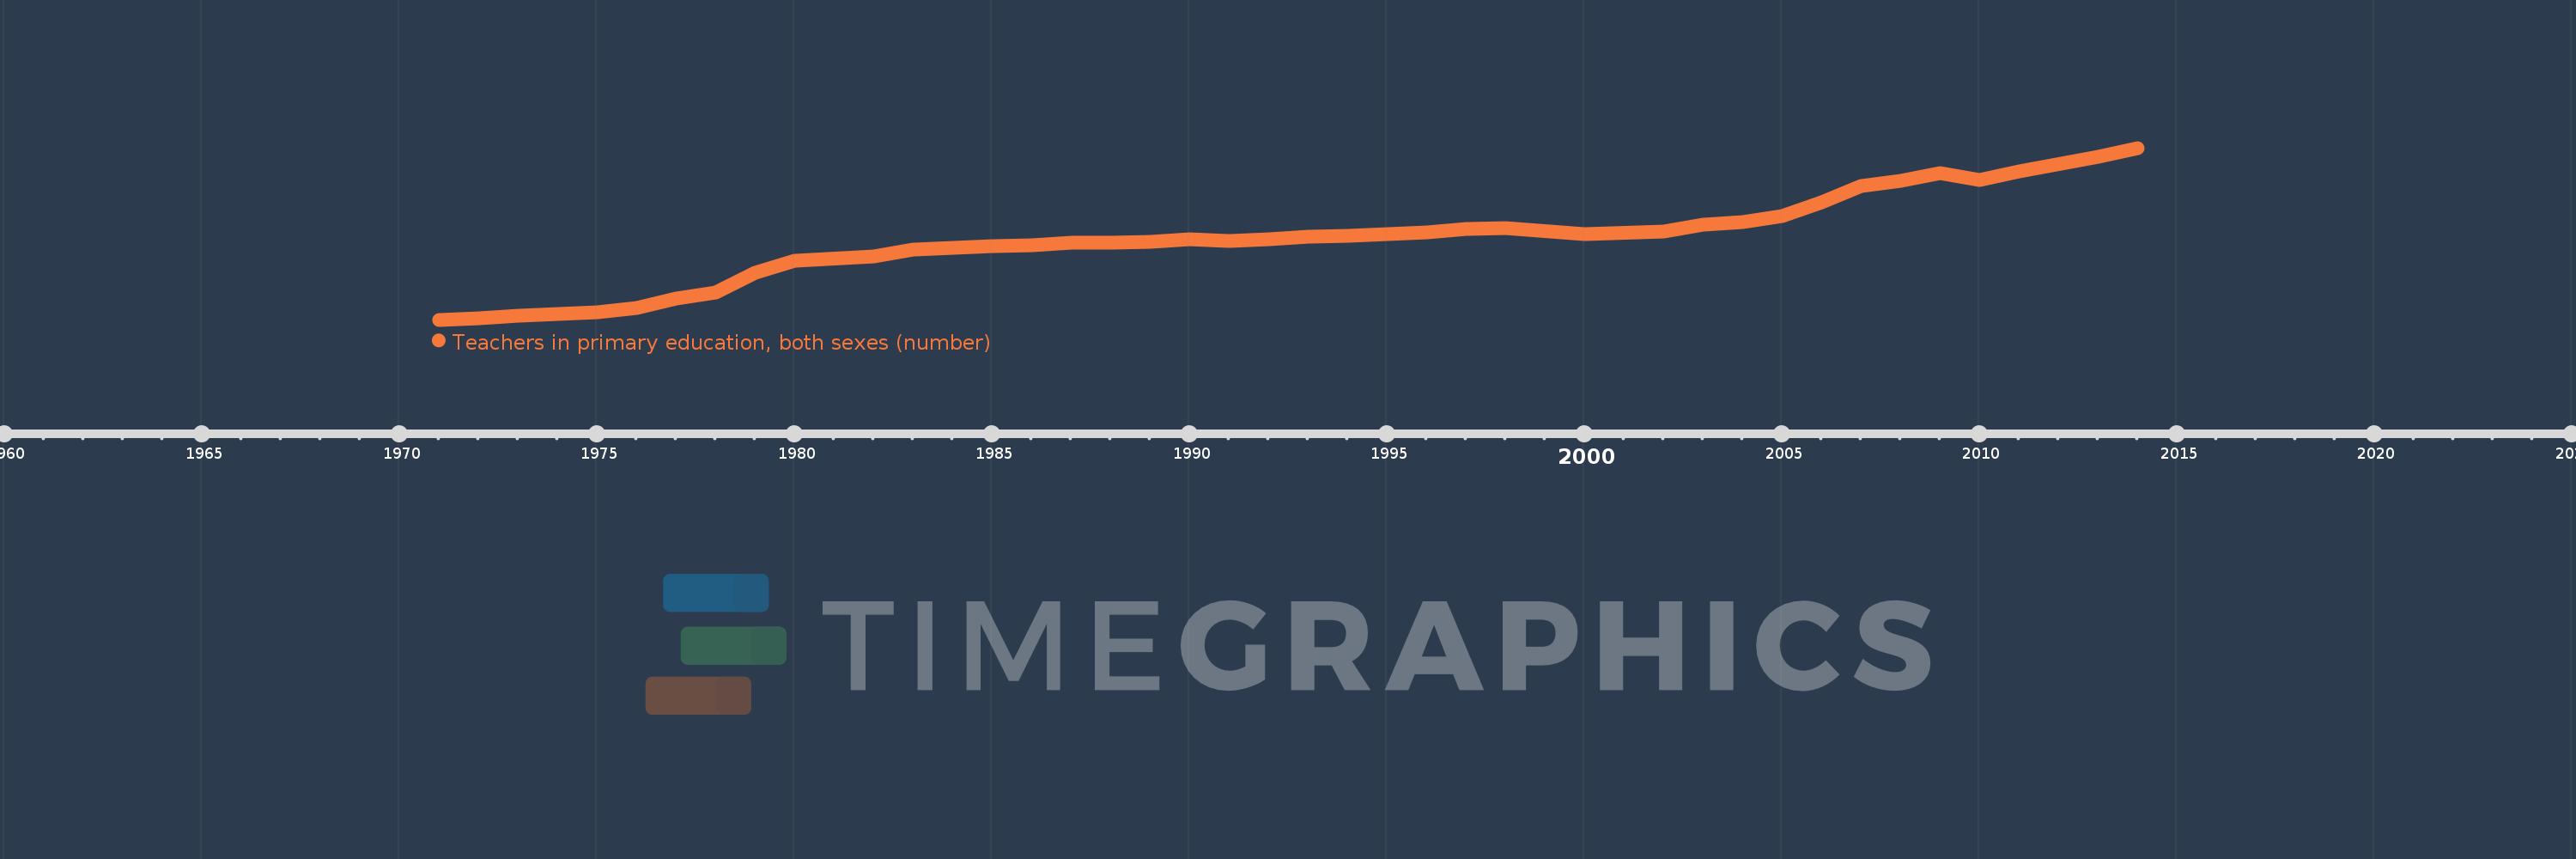
Teachers in primary education, both sexes (number)
2014,2013,2011,2010,2009,2008,2007,2006,2005,2004,2003,2002,2000,1998,1997,1996,1995,1994,1993,1992,1991,1990,1989,1988,1987,1986,1985,1984,1983,1982,1980,1979,1978,1977,1976,1975,1974,1973,1972,1971
This statistics in other country:
AfghanistanAlbaniaAlgeriaAmerican SamoaAndorraAngolaAntigua and BarbudaArab WorldArgentinaArmeniaArubaAustraliaAustriaAzerbaijanBahamas, TheBahrainBangladeshBarbadosBelarusBelgiumBelizeBeninBermudaBhutanBoliviaBosnia and HerzegovinaBotswanaBrazilBritish Virgin IslandsBrunei DarussalamBulgariaBurkina FasoBurundiCabo VerdeCambodiaCameroonCanadaCaribbean small statesCayman IslandsCentral African RepublicCentral Europe and the BalticsChadChileChinaColombiaComorosCongo, Dem. Rep.Congo, Rep.Costa RicaCote d'IvoireCroatiaCubaCyprusCzech RepublicDenmarkDjiboutiDominicaDominican RepublicEarly-demographic dividendEast Asia & PacificEast Asia & Pacific (excluding high income)East Asia & Pacific (IDA & IBRD countries)EcuadorEgypt, Arab Rep.El SalvadorEquatorial GuineaEritreaEstoniaEthiopiaEuro areaEurope & Central AsiaEurope & Central Asia (excluding high income)Europe & Central Asia (IDA & IBRD countries)European UnionFijiFinlandFragile and conflict affected situationsFranceFrench PolynesiaGabonGambia, TheGeorgiaGermanyGhanaGibraltarGreeceGrenadaGuamGuatemalaGuineaGuinea-BissauGuyanaHaitiHeavily indebted poor countries (HIPC)High incomeHondurasHong Kong SAR, ChinaHungaryIBRD onlyIcelandIDA & IBRD totalIDA blendIDA onlyIDA totalIndiaIndonesiaIran, Islamic Rep.IraqIrelandIsraelItalyJamaicaJapanJordanKazakhstanKenyaKiribatiKorea, Dem. People’s Rep.Korea, Rep.KuwaitKyrgyz RepublicLao PDRLate-demographic dividendLatin America & Caribbean Latin America & Caribbean (excluding high income)Latin America & the Caribbean (IDA & IBRD countries)LatviaLeast developed countries: UN classificationLebanonLesothoLiberiaLibyaLiechtensteinLithuaniaLow & middle incomeLow incomeLower middle incomeLuxembourgMacao SAR, ChinaMacedonia, FYRMadagascarMalawiMalaysiaMaldivesMaliMaltaMarshall IslandsMauritaniaMauritiusMexicoMicronesia, Fed. Sts.Middle East & North AfricaMiddle East & North Africa (excluding high income)Middle East & North Africa (IDA & IBRD countries)Middle incomeMoldovaMonacoMongoliaMoroccoMozambiqueMyanmarNamibiaNauruNepalNetherlandsNew CaledoniaNew ZealandNicaraguaNigerNigeriaNorth AmericaNorwayOECD membersOmanOther small statesPacific island small statesPakistanPalauPanamaPapua New GuineaParaguayPeruPhilippinesPolandPortugalPost-demographic dividendPre-demographic dividendPuerto RicoQatarRomaniaRussian FederationRwandaSamoaSan MarinoSao Tome and PrincipeSaudi ArabiaSenegalSerbiaSeychellesSierra LeoneSingaporeSint Maarten (Dutch part)Slovak RepublicSloveniaSmall statesSolomon IslandsSomaliaSouth AfricaSouth AsiaSouth Asia (IDA & IBRD)South SudanSpainSri LankaSt. Kitts and NevisSt. LuciaSt. Vincent and the GrenadinesSub-Saharan Africa Sub-Saharan Africa (excluding high income)Sub-Saharan Africa (IDA & IBRD countries)SudanSurinameSwazilandSwedenSwitzerlandSyrian Arab RepublicTajikistanTanzaniaThailandTimor-LesteTogoTongaTrinidad and TobagoTunisiaTurkeyTurks and Caicos IslandsTuvaluUgandaUkraineUnited Arab EmiratesUnited KingdomUnited StatesUpper middle incomeUruguayUzbekistanVanuatuVenezuela, RBVietnamVirgin Islands (U.S.)West Bank and GazaWorldYemen, Rep.ZambiaZimbabwe Timeline:
This timeline shows a graph from 1971 to 2014 of Tanzania. No data until 1970. Number of actual observations by date: 40.
Source name:
World Development Indicators
Source organization:
UNESCO Institute for Statistics
Categories, topics:
Education
Last updated:
apr 23, 2017
Indicators value changes by year
Minimum:
18.313K
jan 1, 1971
Maximum:
189.487K
jan 1, 2014
At the date of observation
Value
Absolute change
Change from previous value
jan 1, 1971
18.313K
+18.313K
0.0%
jan 1, 1972
20.094K
+1.781K
9.73%
jan 1, 1973
22.36K
+2.266K
11.28%
jan 1, 1974
24.168K
+1.808K
8.09%
jan 1, 1975
25.688K
+1.52K
6.29%
jan 1, 1976
29.735K
+4.047K
15.75%
jan 1, 1977
39.245K
+9.51K
31.98%
jan 1, 1978
45.33K
+6.085K
15.51%
jan 1, 1979
64.822K
+19.492K
43.0%
jan 1, 1980
77.329K
+12.507K
19.29%
jan 1, 1982
81.659K
+4.33K
5.6%
jan 1, 1983
88.37K
+6.711K
8.22%
jan 1, 1984
89.819K
+1.449K
1.64%
jan 1, 1985
91.359K
+1.54K
1.71%
jan 1, 1986
92.586K
+1.227K
1.34%
jan 1, 1987
94.928K
+2.342K
2.53%
jan 1, 1988
95.503K
+575.0
0.61%
jan 1, 1989
95.989K
+486.0
0.51%
jan 1, 1990
98.392K
+2.403K
2.5%
jan 1, 1991
96.85K
-1.542K
-1.57%
jan 1, 1992
98.174K
+1.324K
1.37%
jan 1, 1993
101.306K
+3.132K
3.19%
jan 1, 1994
101.816K
+510.0
0.5%
jan 1, 1995
103.9K
+2.084K
2.05%
jan 1, 1996
105.28K
+1.38K
1.33%
jan 1, 1997
108.874K
+3.594K
3.41%
jan 1, 1998
109.936K
+1.062K
0.98%
jan 1, 2000
104.006K
-5.93K
-5.39%
jan 1, 2002
106.142K
+2.136K
2.05%
jan 1, 2003
112.86K
+6.718K
6.33%
jan 1, 2004
115.34K
+2.48K
2.2%
jan 1, 2005
121.548K
+6.208K
5.38%
jan 1, 2006
135.013K
+13.465K
11.08%
jan 1, 2007
151.882K
+16.869K
12.49%
jan 1, 2008
156.664K
+4.782K
3.15%
jan 1, 2009
164.668K
+8.004K
5.11%
jan 1, 2010
157.185K
-7.483K
-4.54%
jan 1, 2011
165.856K
+8.671K
5.52%
jan 1, 2013
180.987K
+15.131K
9.12%
jan 1, 2014
189.487K
+8.5K
4.7%
Ranking of countries by current statistics by years


Comments: