29
/
en
AIzaSyAYiBZKx7MnpbEhh9jyipgxe19OcubqV5w
April 1, 2024
276226
United Kingdom
GBR
true
2
1
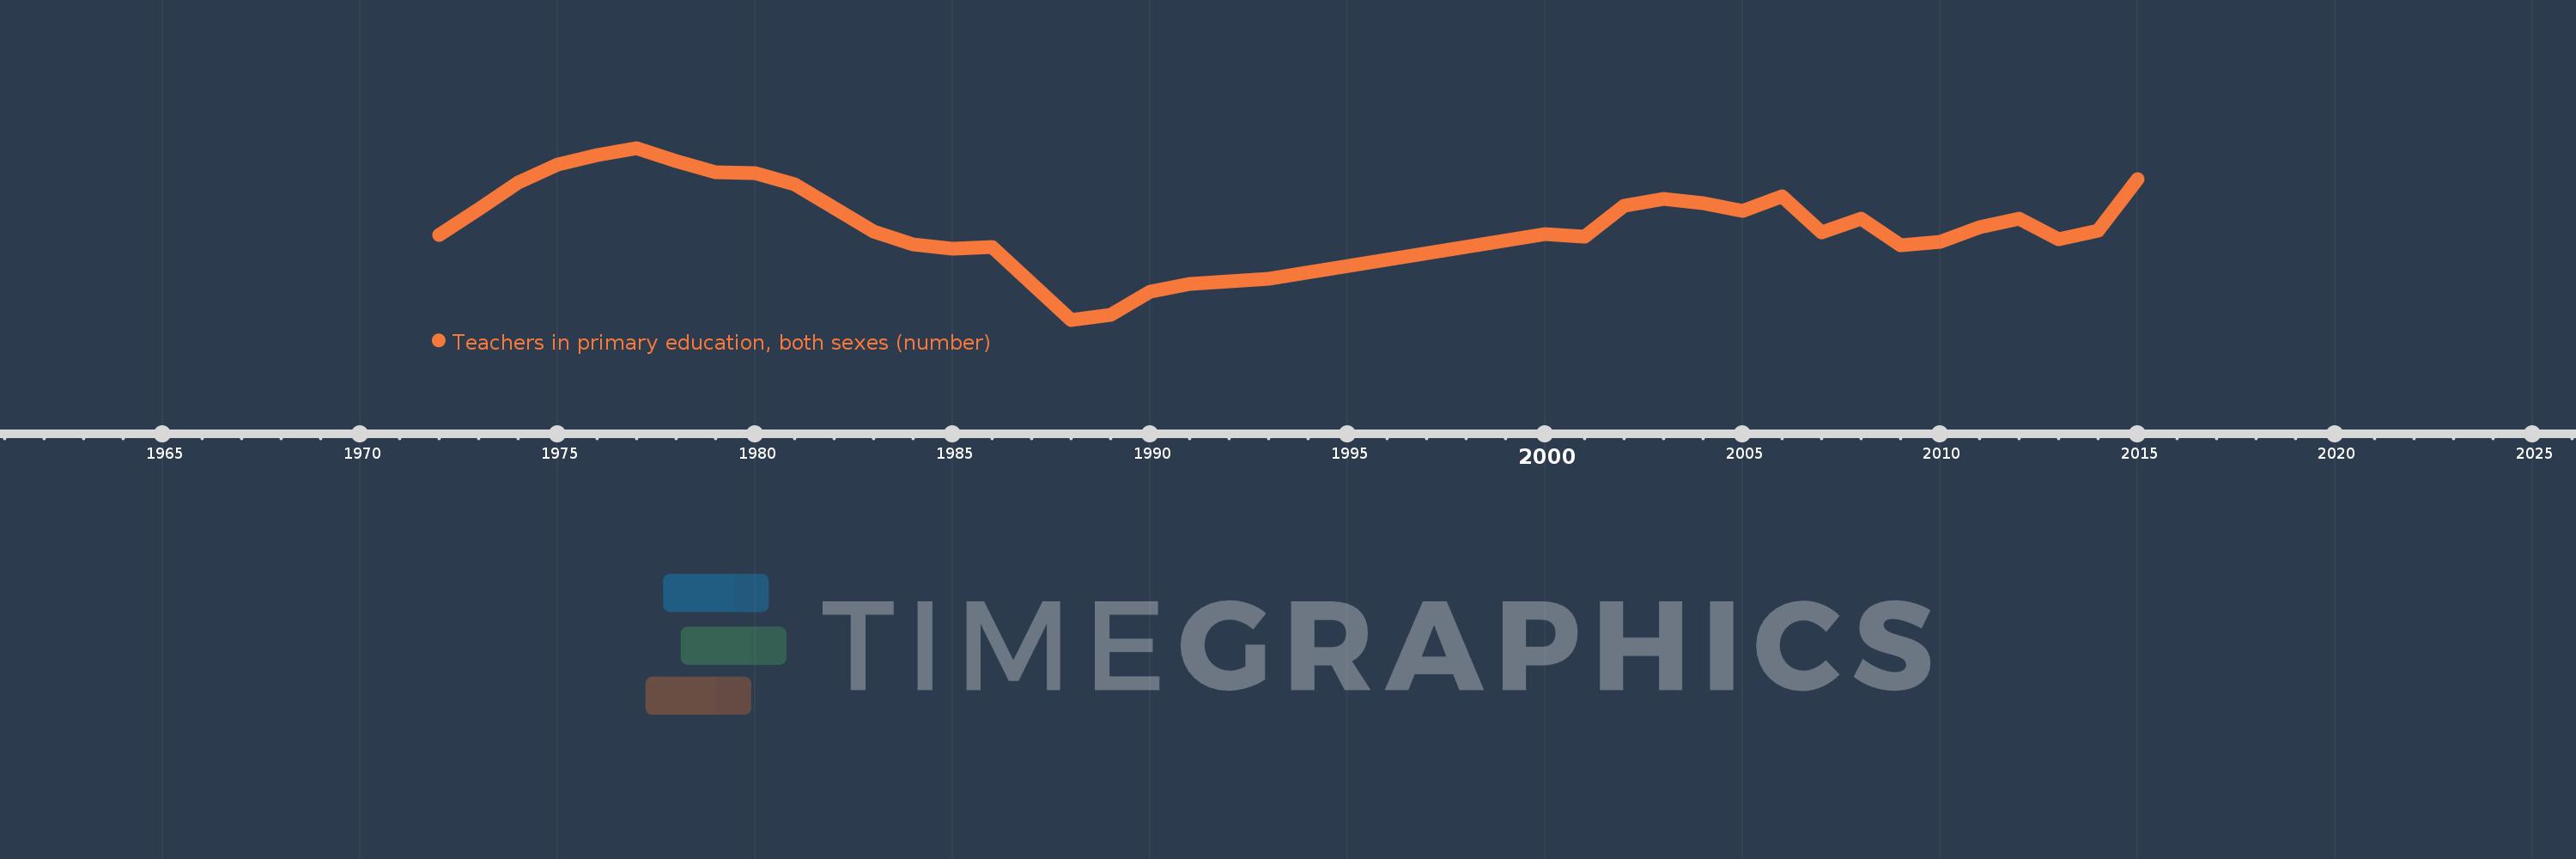
Teachers in primary education, both sexes (number)
2015,2014,2013,2012,2011,2010,2009,2008,2007,2006,2005,2004,2003,2002,2001,2000,1993,1992,1991,1990,1989,1988,1986,1985,1984,1983,1981,1980,1979,1978,1977,1976,1975,1974,1973,1972
This statistics in other country:
AfghanistanAlbaniaAlgeriaAmerican SamoaAndorraAngolaAntigua and BarbudaArab WorldArgentinaArmeniaArubaAustraliaAustriaAzerbaijanBahamas, TheBahrainBangladeshBarbadosBelarusBelgiumBelizeBeninBermudaBhutanBoliviaBosnia and HerzegovinaBotswanaBrazilBritish Virgin IslandsBrunei DarussalamBulgariaBurkina FasoBurundiCabo VerdeCambodiaCameroonCanadaCaribbean small statesCayman IslandsCentral African RepublicCentral Europe and the BalticsChadChileChinaColombiaComorosCongo, Dem. Rep.Congo, Rep.Costa RicaCote d'IvoireCroatiaCubaCyprusCzech RepublicDenmarkDjiboutiDominicaDominican RepublicEarly-demographic dividendEast Asia & PacificEast Asia & Pacific (excluding high income)East Asia & Pacific (IDA & IBRD countries)EcuadorEgypt, Arab Rep.El SalvadorEquatorial GuineaEritreaEstoniaEthiopiaEuro areaEurope & Central AsiaEurope & Central Asia (excluding high income)Europe & Central Asia (IDA & IBRD countries)European UnionFijiFinlandFragile and conflict affected situationsFranceFrench PolynesiaGabonGambia, TheGeorgiaGermanyGhanaGibraltarGreeceGrenadaGuamGuatemalaGuineaGuinea-BissauGuyanaHaitiHeavily indebted poor countries (HIPC)High incomeHondurasHong Kong SAR, ChinaHungaryIBRD onlyIcelandIDA & IBRD totalIDA blendIDA onlyIDA totalIndiaIndonesiaIran, Islamic Rep.IraqIrelandIsraelItalyJamaicaJapanJordanKazakhstanKenyaKiribatiKorea, Dem. People’s Rep.Korea, Rep.KuwaitKyrgyz RepublicLao PDRLate-demographic dividendLatin America & Caribbean Latin America & Caribbean (excluding high income)Latin America & the Caribbean (IDA & IBRD countries)LatviaLeast developed countries: UN classificationLebanonLesothoLiberiaLibyaLiechtensteinLithuaniaLow & middle incomeLow incomeLower middle incomeLuxembourgMacao SAR, ChinaMacedonia, FYRMadagascarMalawiMalaysiaMaldivesMaliMaltaMarshall IslandsMauritaniaMauritiusMexicoMicronesia, Fed. Sts.Middle East & North AfricaMiddle East & North Africa (excluding high income)Middle East & North Africa (IDA & IBRD countries)Middle incomeMoldovaMonacoMongoliaMoroccoMozambiqueMyanmarNamibiaNauruNepalNetherlandsNew CaledoniaNew ZealandNicaraguaNigerNigeriaNorth AmericaNorwayOECD membersOmanOther small statesPacific island small statesPakistanPalauPanamaPapua New GuineaParaguayPeruPhilippinesPolandPortugalPost-demographic dividendPre-demographic dividendPuerto RicoQatarRomaniaRussian FederationRwandaSamoaSan MarinoSao Tome and PrincipeSaudi ArabiaSenegalSerbiaSeychellesSierra LeoneSingaporeSint Maarten (Dutch part)Slovak RepublicSloveniaSmall statesSolomon IslandsSomaliaSouth AfricaSouth AsiaSouth Asia (IDA & IBRD)South SudanSpainSri LankaSt. Kitts and NevisSt. LuciaSt. Vincent and the GrenadinesSub-Saharan Africa Sub-Saharan Africa (excluding high income)Sub-Saharan Africa (IDA & IBRD countries)SudanSurinameSwazilandSwedenSwitzerlandSyrian Arab RepublicTajikistanTanzaniaThailandTimor-LesteTogoTongaTrinidad and TobagoTunisiaTurkeyTurks and Caicos IslandsTuvaluUgandaUkraineUnited Arab EmiratesUnited KingdomUnited StatesUpper middle incomeUruguayUzbekistanVanuatuVenezuela, RBVietnamVirgin Islands (U.S.)West Bank and GazaWorldYemen, Rep.ZambiaZimbabwe Timeline:
This timeline shows a graph from 1972 to 2015 of United Kingdom. No data until 1971. Number of actual observations by date: 36.
Source name:
World Development Indicators
Source organization:
UNESCO Institute for Statistics
Categories, topics:
Education
Last updated:
apr 23, 2017
Indicators value changes by year
Minimum:
213.0K
jan 1, 1988
Maximum:
285.786K
jan 1, 1977
At the date of observation
Value
Absolute change
Change from previous value
jan 1, 1972
248.908K
+248.908K
0.0%
jan 1, 1973
259.757K
+10.849K
4.36%
jan 1, 1974
271.074K
+11.317K
4.36%
jan 1, 1975
278.609K
+7.535K
2.78%
jan 1, 1976
282.793K
+4.184K
1.5%
jan 1, 1977
285.786K
+2.993K
1.06%
jan 1, 1978
280.315K
-5.471K
-1.91%
jan 1, 1979
275.564K
-4.751K
-1.69%
jan 1, 1980
275.02K
-544.0
-0.2%
jan 1, 1981
270.346K
-4.674K
-1.7%
jan 1, 1983
250.51K
-19.836K
-7.34%
jan 1, 1984
245.0K
-5.51K
-2.2%
jan 1, 1985
243.0K
-2.0K
-0.82%
jan 1, 1986
244.0K
+1000.0
0.41%
jan 1, 1988
213.0K
-31.0K
-12.7%
jan 1, 1989
215.0K
+2.0K
0.94%
jan 1, 1990
225.0K
+10.0K
4.65%
jan 1, 1991
228.0K
+3.0K
1.33%
jan 1, 1992
229.1K
+1.1K
0.48%
jan 1, 1993
230.2K
+1.1K
0.48%
jan 1, 2000
249.384K
+19.184K
8.33%
jan 1, 2001
248.148K
-1.236K
-0.5%
jan 1, 2002
261.362K
+13.214K
5.33%
jan 1, 2003
264.111K
+2.749K
1.05%
jan 1, 2004
262.39K
-1.721K
-0.65%
jan 1, 2005
258.966K
-3.424K
-1.3%
jan 1, 2006
265.257K
+6.291K
2.43%
jan 1, 2007
249.862K
-15.395K
-5.8%
jan 1, 2008
255.69K
+5.828K
2.33%
jan 1, 2009
244.391K
-11.299K
-4.42%
jan 1, 2010
245.879K
+1.488K
0.61%
jan 1, 2011
252.29K
+6.411K
2.61%
jan 1, 2012
255.994K
+3.704K
1.47%
jan 1, 2013
247.079K
-8.915K
-3.48%
jan 1, 2014
250.693K
+3.614K
1.46%
jan 1, 2015
272.43K
+21.737K
8.67%
Ranking of countries by current statistics by years


Comments: