29
/
en
AIzaSyAYiBZKx7MnpbEhh9jyipgxe19OcubqV5w
April 1, 2024
84835
Benin
BEN
true
2
1
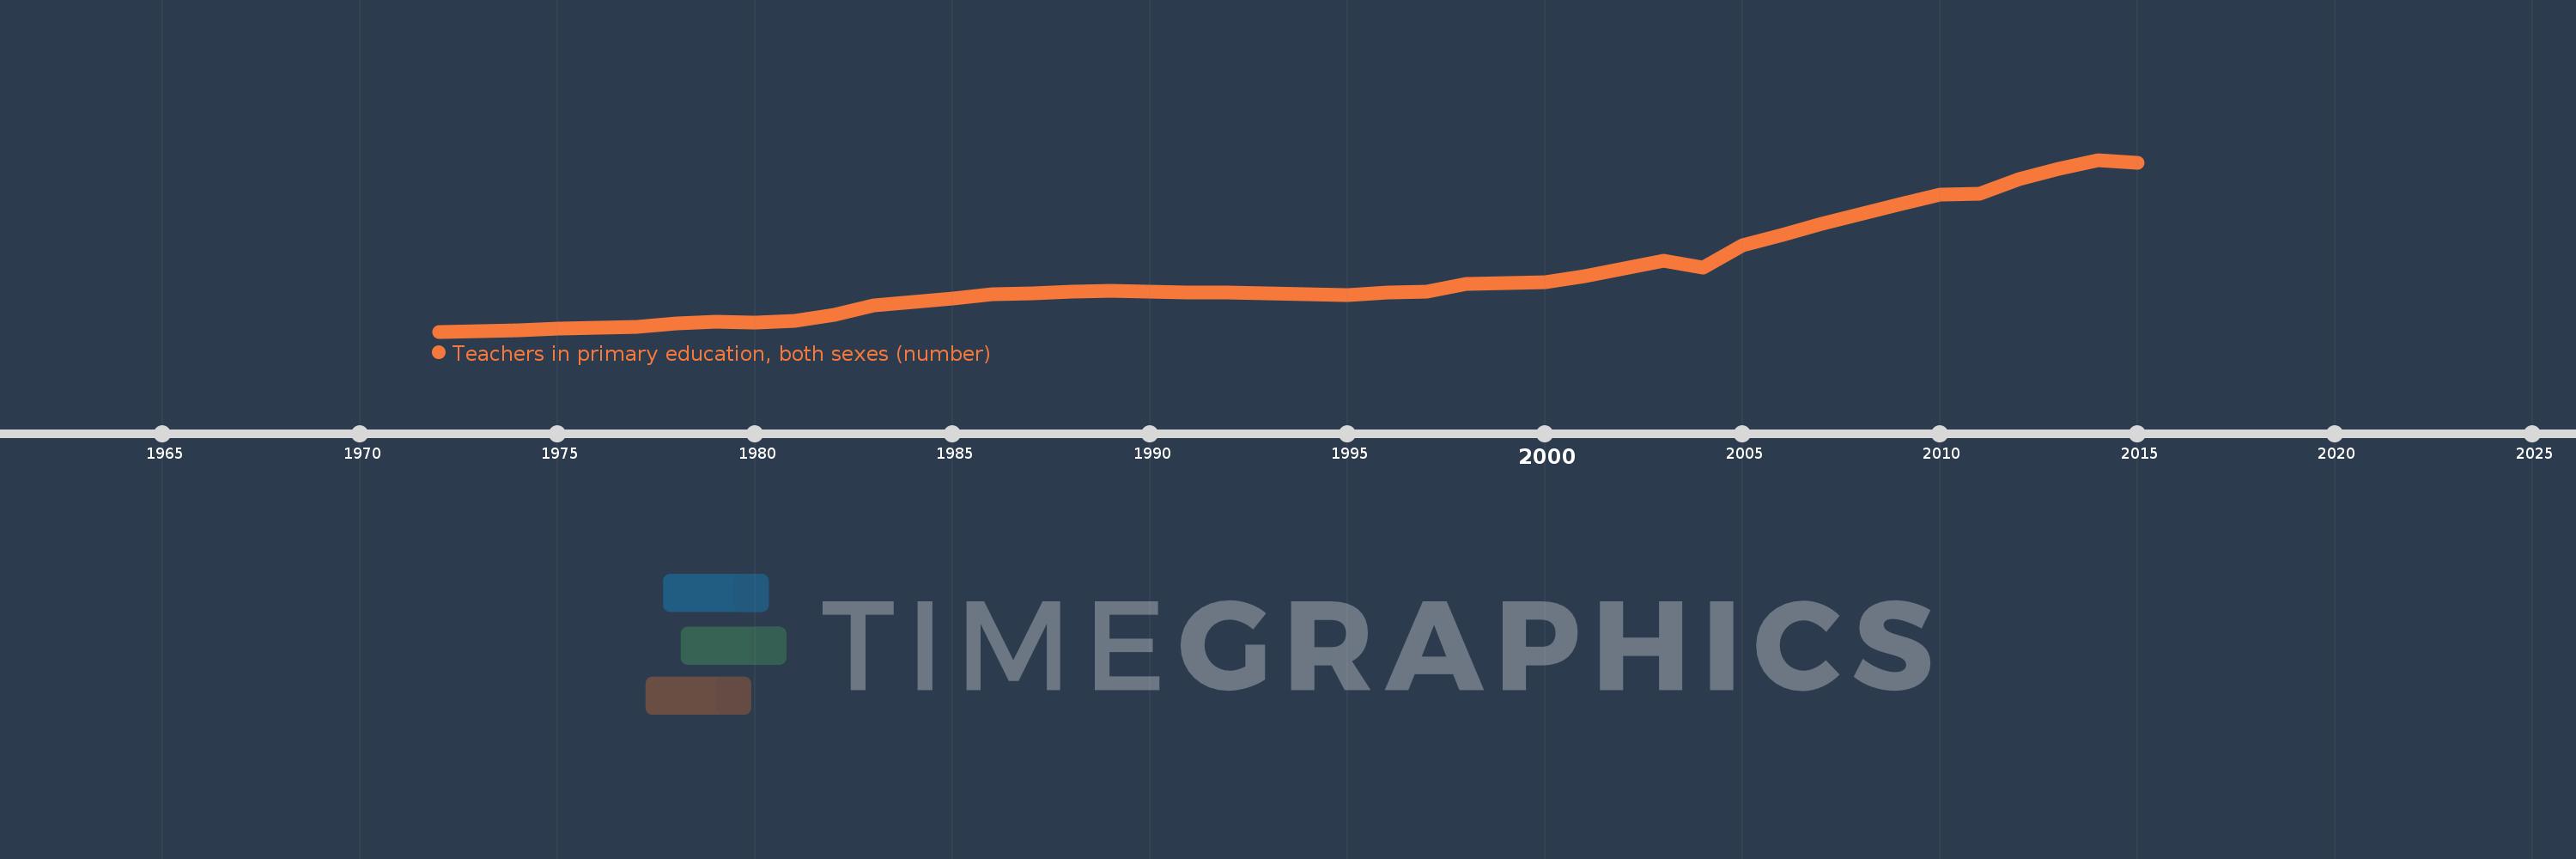
Teachers in primary education, both sexes (number)
2015,2014,2013,2012,2011,2010,2009,2007,2006,2005,2004,2003,2002,2001,2000,1999,1998,1997,1996,1995,1994,1993,1992,1991,1990,1989,1988,1987,1986,1985,1984,1983,1982,1981,1980,1979,1978,1977,1976,1975,1974,1973,1972
This statistics in other country:
AfghanistanAlbaniaAlgeriaAmerican SamoaAndorraAngolaAntigua and BarbudaArab WorldArgentinaArmeniaArubaAustraliaAustriaAzerbaijanBahamas, TheBahrainBangladeshBarbadosBelarusBelgiumBelizeBeninBermudaBhutanBoliviaBosnia and HerzegovinaBotswanaBrazilBritish Virgin IslandsBrunei DarussalamBulgariaBurkina FasoBurundiCabo VerdeCambodiaCameroonCanadaCaribbean small statesCayman IslandsCentral African RepublicCentral Europe and the BalticsChadChileChinaColombiaComorosCongo, Dem. Rep.Congo, Rep.Costa RicaCote d'IvoireCroatiaCubaCyprusCzech RepublicDenmarkDjiboutiDominicaDominican RepublicEarly-demographic dividendEast Asia & PacificEast Asia & Pacific (excluding high income)East Asia & Pacific (IDA & IBRD countries)EcuadorEgypt, Arab Rep.El SalvadorEquatorial GuineaEritreaEstoniaEthiopiaEuro areaEurope & Central AsiaEurope & Central Asia (excluding high income)Europe & Central Asia (IDA & IBRD countries)European UnionFijiFinlandFragile and conflict affected situationsFranceFrench PolynesiaGabonGambia, TheGeorgiaGermanyGhanaGibraltarGreeceGrenadaGuamGuatemalaGuineaGuinea-BissauGuyanaHaitiHeavily indebted poor countries (HIPC)High incomeHondurasHong Kong SAR, ChinaHungaryIBRD onlyIcelandIDA & IBRD totalIDA blendIDA onlyIDA totalIndiaIndonesiaIran, Islamic Rep.IraqIrelandIsraelItalyJamaicaJapanJordanKazakhstanKenyaKiribatiKorea, Dem. People’s Rep.Korea, Rep.KuwaitKyrgyz RepublicLao PDRLate-demographic dividendLatin America & Caribbean Latin America & Caribbean (excluding high income)Latin America & the Caribbean (IDA & IBRD countries)LatviaLeast developed countries: UN classificationLebanonLesothoLiberiaLibyaLiechtensteinLithuaniaLow & middle incomeLow incomeLower middle incomeLuxembourgMacao SAR, ChinaMacedonia, FYRMadagascarMalawiMalaysiaMaldivesMaliMaltaMarshall IslandsMauritaniaMauritiusMexicoMicronesia, Fed. Sts.Middle East & North AfricaMiddle East & North Africa (excluding high income)Middle East & North Africa (IDA & IBRD countries)Middle incomeMoldovaMonacoMongoliaMoroccoMozambiqueMyanmarNamibiaNauruNepalNetherlandsNew CaledoniaNew ZealandNicaraguaNigerNigeriaNorth AmericaNorwayOECD membersOmanOther small statesPacific island small statesPakistanPalauPanamaPapua New GuineaParaguayPeruPhilippinesPolandPortugalPost-demographic dividendPre-demographic dividendPuerto RicoQatarRomaniaRussian FederationRwandaSamoaSan MarinoSao Tome and PrincipeSaudi ArabiaSenegalSerbiaSeychellesSierra LeoneSingaporeSint Maarten (Dutch part)Slovak RepublicSloveniaSmall statesSolomon IslandsSomaliaSouth AfricaSouth AsiaSouth Asia (IDA & IBRD)South SudanSpainSri LankaSt. Kitts and NevisSt. LuciaSt. Vincent and the GrenadinesSub-Saharan Africa Sub-Saharan Africa (excluding high income)Sub-Saharan Africa (IDA & IBRD countries)SudanSurinameSwazilandSwedenSwitzerlandSyrian Arab RepublicTajikistanTanzaniaThailandTimor-LesteTogoTongaTrinidad and TobagoTunisiaTurkeyTurks and Caicos IslandsTuvaluUgandaUkraineUnited Arab EmiratesUnited KingdomUnited StatesUpper middle incomeUruguayUzbekistanVanuatuVenezuela, RBVietnamVirgin Islands (U.S.)West Bank and GazaWorldYemen, Rep.ZambiaZimbabwe Timeline:
This timeline shows a graph from 1972 to 2015 of Benin. No data until 1971. Number of actual observations by date: 43.
Source name:
World Development Indicators
Source organization:
UNESCO Institute for Statistics
Categories, topics:
Education
Last updated:
apr 23, 2017
Indicators value changes by year
Minimum:
3.753K
jan 1, 1972
Maximum:
47.201K
jan 1, 2014
At the date of observation
Value
Absolute change
Change from previous value
jan 1, 1972
3.753K
+3.753K
0.0%
jan 1, 1973
3.929K
+176.0
4.69%
jan 1, 1974
4.184K
+255.0
6.49%
jan 1, 1975
4.45K
+266.0
6.36%
jan 1, 1976
4.708K
+258.0
5.8%
jan 1, 1977
4.864K
+156.0
3.31%
jan 1, 1978
5.786K
+922.0
18.96%
jan 1, 1979
6.326K
+540.0
9.33%
jan 1, 1980
6.048K
-278.0
-4.39%
jan 1, 1981
6.547K
+499.0
8.25%
jan 1, 1982
7.994K
+1.447K
22.1%
jan 1, 1983
10.381K
+2.387K
29.86%
jan 1, 1984
11.339K
+958.0
9.23%
jan 1, 1985
12.163K
+824.0
7.27%
jan 1, 1986
13.269K
+1.106K
9.09%
jan 1, 1987
13.452K
+183.0
1.38%
jan 1, 1988
13.867K
+415.0
3.09%
jan 1, 1989
14.067K
+200.0
1.44%
jan 1, 1990
13.821K
-246.0
-1.75%
jan 1, 1991
13.693K
-128.0
-0.93%
jan 1, 1992
13.556K
-137.0
-1.0%
jan 1, 1993
13.422K
-134.0
-0.99%
jan 1, 1994
13.184K
-238.0
-1.77%
jan 1, 1995
12.924K
-260.0
-1.97%
jan 1, 1996
13.586K
+662.0
5.12%
jan 1, 1997
13.889K
+303.0
2.23%
jan 1, 1998
15.705K
+1.816K
13.08%
jan 1, 1999
16.043K
+338.0
2.15%
jan 1, 2000
16.335K
+292.0
1.82%
jan 1, 2001
17.71K
+1.375K
8.42%
jan 1, 2002
19.71K
+2.0K
11.29%
jan 1, 2003
21.766K
+2.056K
10.43%
jan 1, 2004
19.836K
-1.93K
-8.87%
jan 1, 2005
25.583K
+5.747K
28.97%
jan 1, 2006
28.148K
+2.565K
10.03%
jan 1, 2007
31.103K
+2.955K
10.5%
jan 1, 2009
35.938K
+4.835K
15.55%
jan 1, 2010
38.321K
+2.383K
6.63%
jan 1, 2011
38.54K
+219.0
0.57%
jan 1, 2012
42.293K
+3.753K
9.74%
jan 1, 2013
45.01K
+2.717K
6.42%
jan 1, 2014
47.201K
+2.191K
4.87%
jan 1, 2015
46.454K
-747.0
-1.58%
Ranking of countries by current statistics by years


Comments: