29
/
en
AIzaSyAYiBZKx7MnpbEhh9jyipgxe19OcubqV5w
April 1, 2024
287325
Zimbabwe
ZWE
true
2
1
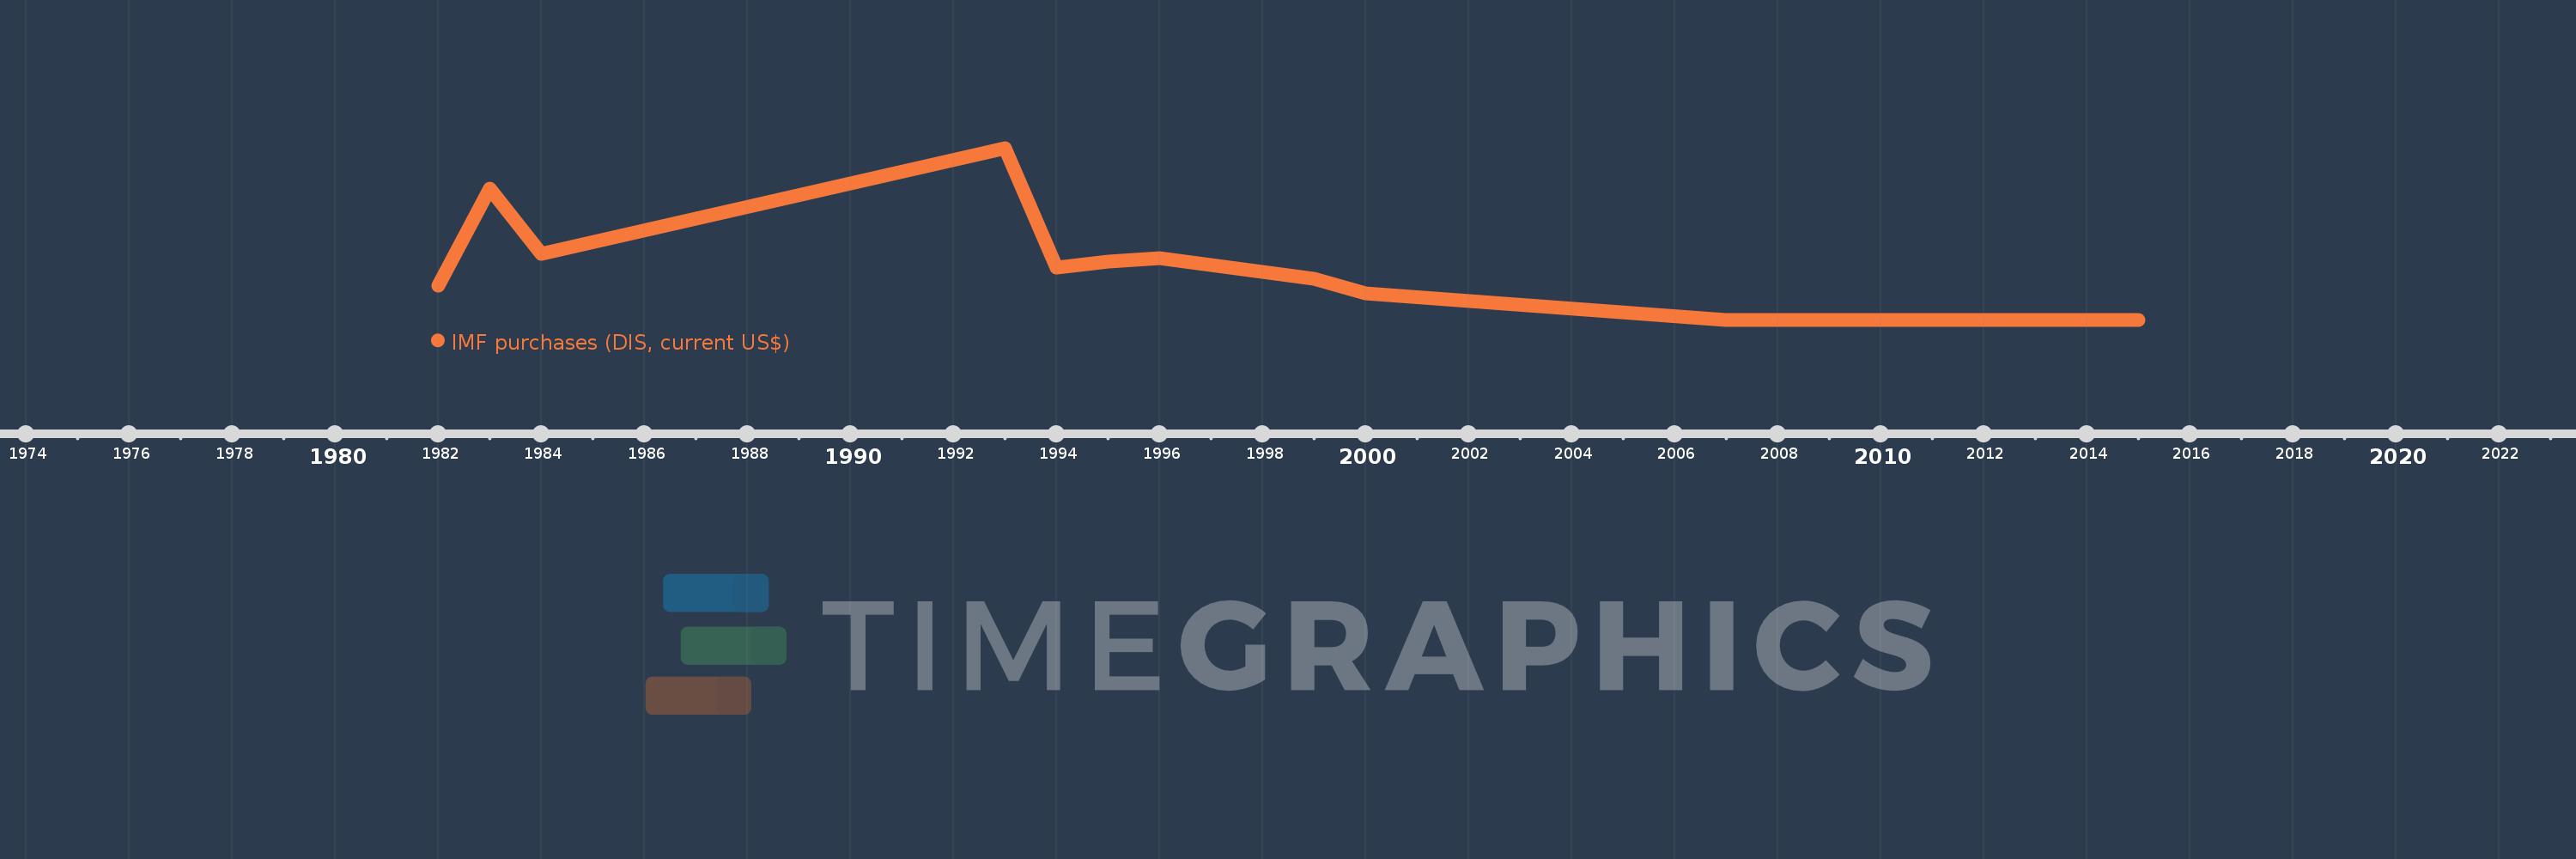
IMF purchases (DIS, current US$)
2015,2007,2000,1999,1996,1995,1994,1993,1984,1983,1982
This statistics in other country:
Timeline:
This timeline shows a graph from 1982 to 2015 of Zimbabwe. No data until 1981. Number of actual observations by date: 11.
Source name:
World Development Indicators
Source organization:
World Bank, International Debt Statistics.
Categories, topics:
External Debt
Last updated:
apr 23, 2017
Indicators value changes by year
Maximum:
221.434 mln
jan 1, 1993
At the date of observation
Value
Absolute change
Change from previous value
jan 1, 1982
44.2 mln
+44.2 mln
0.0%
jan 1, 1983
169.615 mln
+125.415 mln
283.74%
jan 1, 1984
85.101 mln
-84.514 mln
-49.83%
jan 1, 1993
221.434 mln
+136.333 mln
160.2%
jan 1, 1994
66.747 mln
-154.687 mln
-69.86%
jan 1, 1995
75.183 mln
+8.436 mln
12.64%
jan 1, 1996
79.655 mln
+4.472 mln
5.95%
jan 1, 1999
53.186 mln
-26.469 mln
-33.23%
jan 1, 2000
33.829 mln
-19.357 mln
-36.39%
jan 1, 2007
0.0
-33.829 mln
-100.0%
Ranking of countries by current statistics by years


Comments: