29
/
en
AIzaSyAYiBZKx7MnpbEhh9jyipgxe19OcubqV5w
April 1, 2024
201687
Morocco
MAR
true
2
1
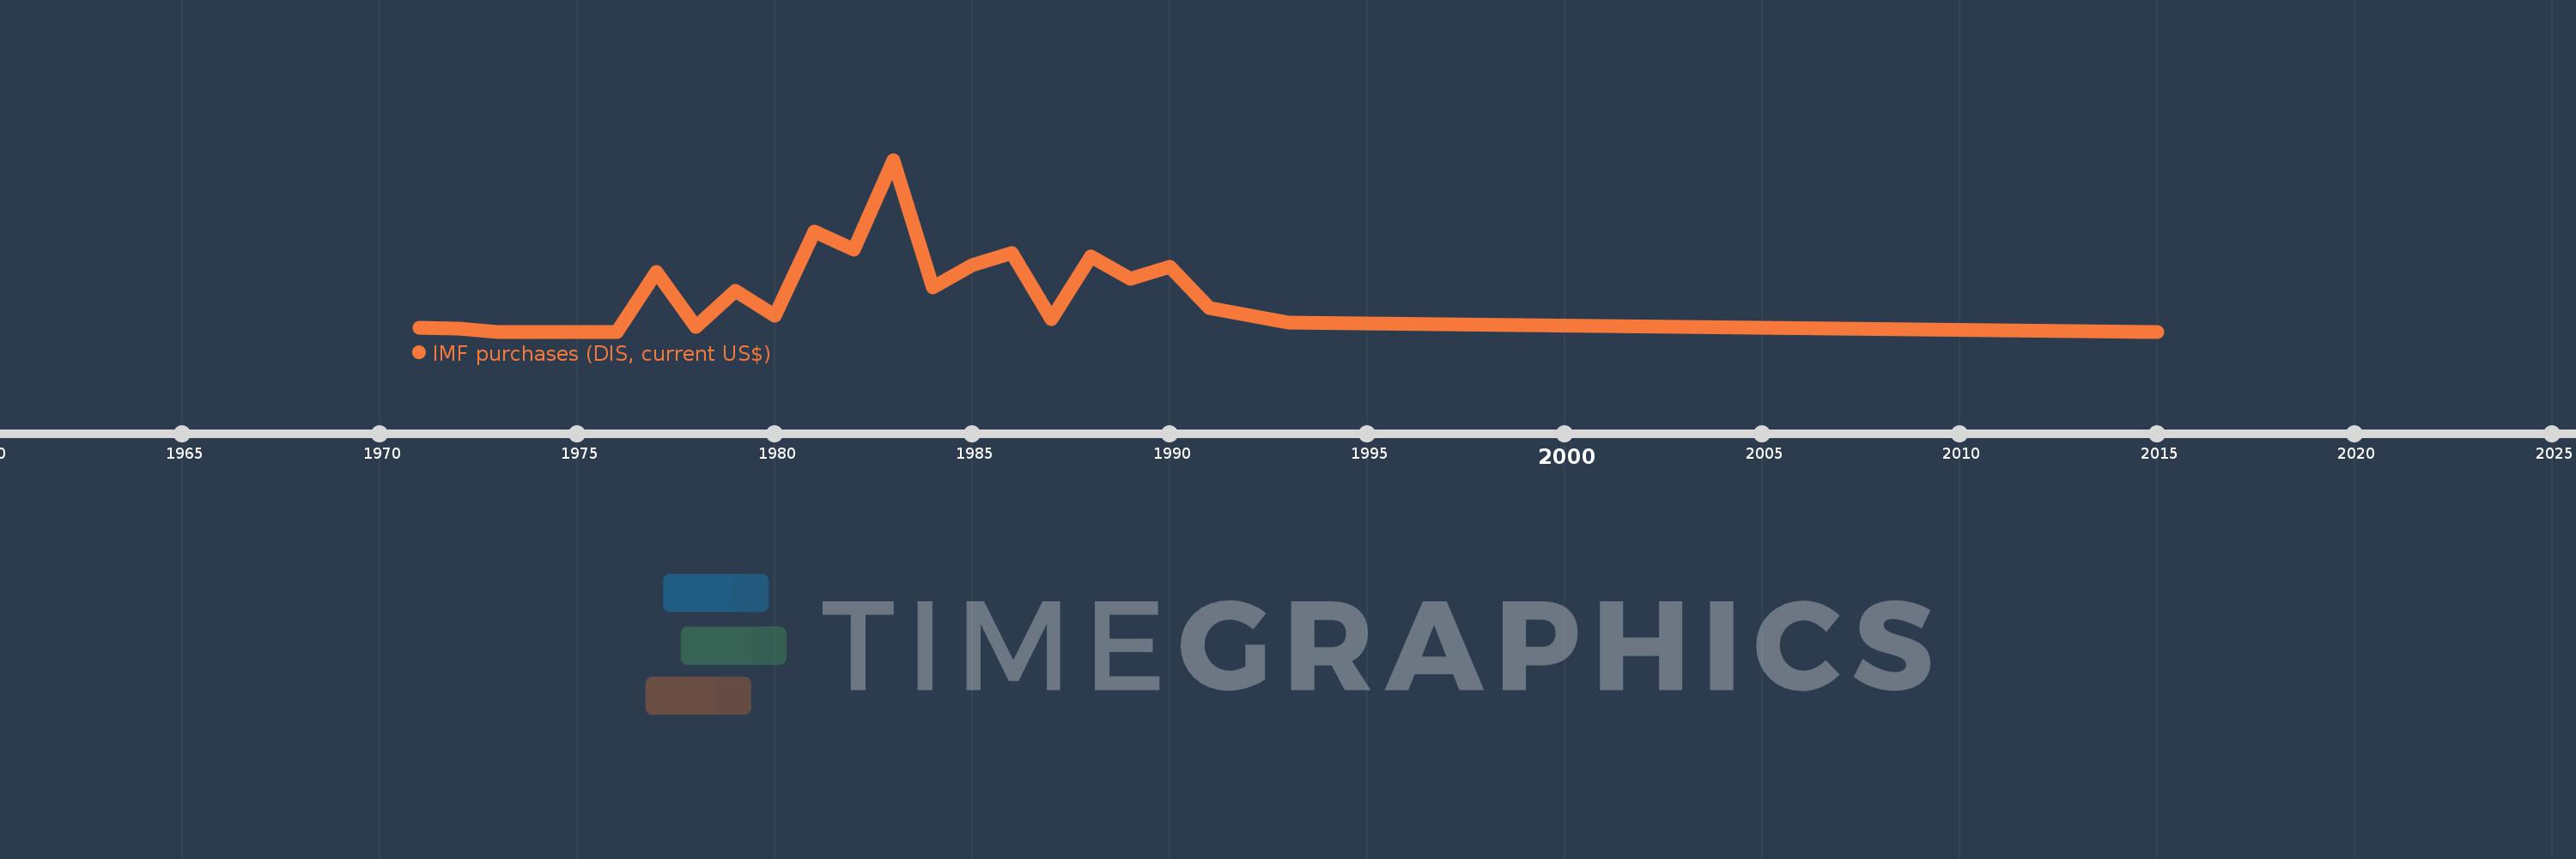
IMF purchases (DIS, current US$)
2015,1993,1991,1990,1989,1988,1987,1986,1985,1984,1983,1982,1981,1980,1979,1978,1977,1976,1975,1974,1973,1972,1971
This statistics in other country:
Timeline:
This timeline shows a graph from 1971 to 2015 of Morocco. No data until 1970. Number of actual observations by date: 23.
Source name:
World Development Indicators
Source organization:
World Bank, International Debt Statistics.
Categories, topics:
External Debt
Last updated:
apr 23, 2017
Indicators value changes by year
Maximum:
478.3 mln
jan 1, 1983
At the date of observation
Value
Absolute change
Change from previous value
jan 1, 1971
10.0 mln
+10.0 mln
0.0%
jan 1, 1972
8.276 mln
-1.724 mln
-17.24%
jan 1, 1973
0.0
-8.276 mln
-100.0%
jan 1, 1977
166.0 mln
+166.0 mln
%
jan 1, 1978
14.117 mln
-151.883 mln
-91.5%
jan 1, 1979
113.614 mln
+99.497 mln
704.8%
jan 1, 1980
44.239 mln
-69.375 mln
-61.06%
jan 1, 1981
277.752 mln
+233.513 mln
527.84%
jan 1, 1982
227.3 mln
-50.452 mln
-18.16%
jan 1, 1983
478.3 mln
+251.0 mln
110.43%
jan 1, 1984
122.3 mln
-356.0 mln
-74.43%
jan 1, 1985
184.5 mln
+62.2 mln
50.86%
jan 1, 1986
218.4 mln
+33.9 mln
18.37%
jan 1, 1987
35.2 mln
-183.2 mln
-83.88%
jan 1, 1988
209.572 mln
+174.372 mln
495.38%
jan 1, 1989
147.866 mln
-61.706 mln
-29.44%
jan 1, 1990
179.47 mln
+31.604 mln
21.37%
jan 1, 1991
65.167 mln
-114.303 mln
-63.69%
jan 1, 1993
25.913 mln
-39.254 mln
-60.24%
jan 1, 2015
0.0
-25.913 mln
-100.0%
Ranking of countries by current statistics by years


Comments: