29
/
en
AIzaSyAYiBZKx7MnpbEhh9jyipgxe19OcubqV5w
April 1, 2024
273701
Ukraine
UKR
true
2
1
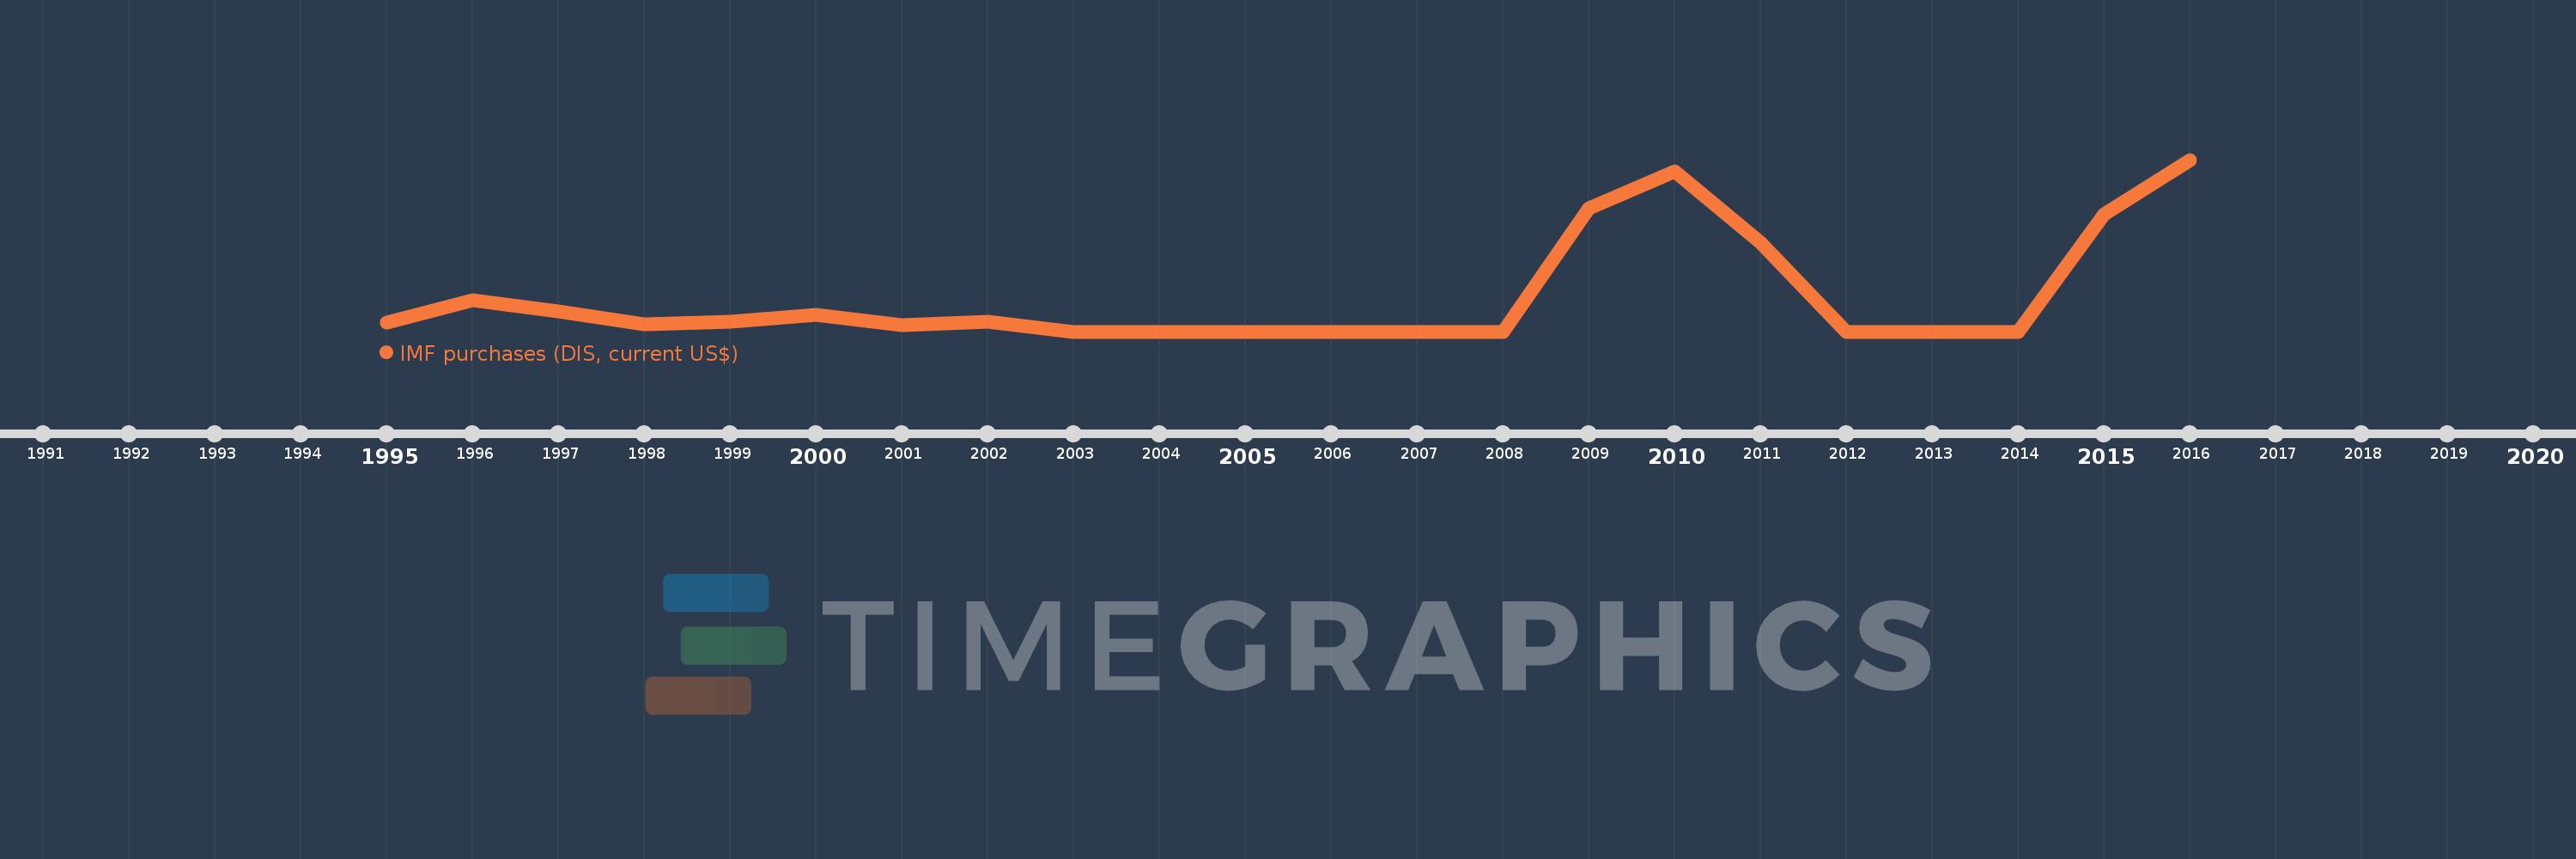
IMF purchases (DIS, current US$)
2016,2015,2014,2013,2012,2011,2010,2009,2008,2007,2006,2005,2004,2003,2002,2001,2000,1999,1998,1997,1996,1995
This statistics in other country:
Timeline:
This timeline shows a graph from 1995 to 2016 of Ukraine. No data until 1994. Number of actual observations by date: 22.
Source name:
World Development Indicators
Source organization:
World Bank, International Debt Statistics.
Categories, topics:
External Debt
Last updated:
apr 23, 2017
Indicators value changes by year
Maximum:
6.615 bln
jan 1, 2016
At the date of observation
Value
Absolute change
Change from previous value
jan 1, 1995
357.049 mln
+357.049 mln
0.0%
jan 1, 1996
1.196 bln
+838.496 mln
234.84%
jan 1, 1997
778.157 mln
-417.388 mln
-34.91%
jan 1, 1998
285.211 mln
-492.946 mln
-63.35%
jan 1, 1999
382.362 mln
+97.151 mln
34.06%
jan 1, 2000
638.025 mln
+255.663 mln
66.86%
jan 1, 2001
250.703 mln
-387.322 mln
-60.71%
jan 1, 2002
370.19 mln
+119.487 mln
47.66%
jan 1, 2003
0.0
-370.19 mln
-100.0%
jan 1, 2009
4.742 bln
+4.742 bln
%
jan 1, 2010
6.17 bln
+1.428 bln
30.11%
jan 1, 2011
3.433 bln
-2.737 bln
-44.35%
jan 1, 2012
0.0
-3.433 bln
-100.0%
jan 1, 2015
4.516 bln
+4.516 bln
%
jan 1, 2016
6.615 bln
+2.099 bln
46.47%
Ranking of countries by current statistics by years


Comments: